Search our Knowledge Base
Search

Bing Webmaster Tools Search Keywords


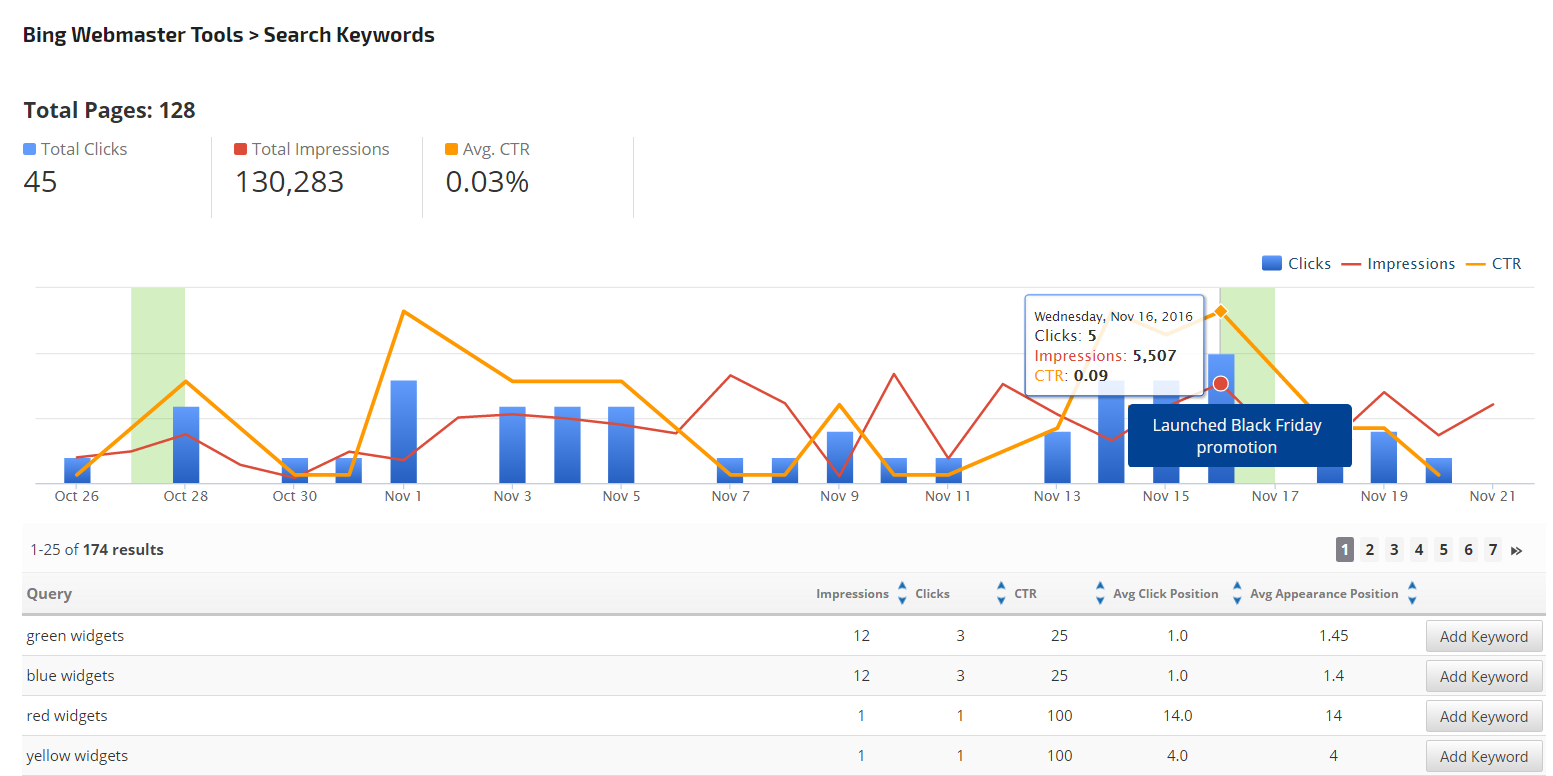
The Bing Webmaster Tools Search Keywords report displays a combination graph and table detailing a site's Bing search performance. Keywords with the corresponding number of Impressions, Clicks, Click-thru-Rate, Average Click Position, and Average Appearance Position in Bing search display in a sortable table. The multi-axis graph charts the search metrics for each date.

Data provided in this report is without filters, so it displays all Search, all Locations and all Traffic queries. Please note that there can be a delay of approximately 3 days between the time that Bing compiles and releases this data via their API.  Please note that Bing's data storage policy restricts data history to 6 months.

Important! To view this report Bing Webmaster Tools must be configured correctly, please refer to Rank Ranger's Bing integration documentation.


Bing Webmaster Tools Search Keywords report
 

Screenshots

 
Bing Webmaster Tools Search Keywords report
 
Bing Webmaster Tools Search Keywords report


Bing Search Keywords Graph

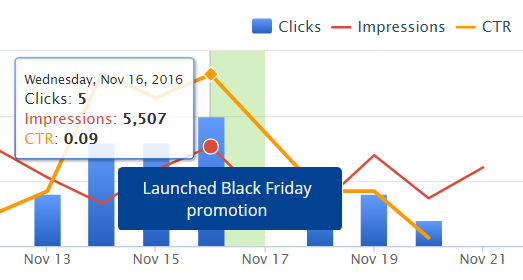
While viewing the graph, you can hover over any point to view the number of Clicks,  Impressions, and Click Through Rate for a specific date. If you have added Notes or Events to the campaign, they display with the colored background you selected and can be hovered over to read the message.

Bing Page Traffic graph


Bing Keyword Traffic Statistics Table

In this traffic statistics table, you are presented with data for each keyword that a Bing user queried that caused the tracked site to display in the search engine results.  While viewing the report, you can click the arrows at the top of the Impressions, Clicks, CTR, Avg. Click Position,  and Avg. Appearance Position columns to change the sort to ascending or descending order.  You can also click the Add Keyword button to add the keyword to the campaign and begin rank tracking.

Bing Search Keyword analysis

About the Page Metrics
  • Impressions: the number of times the page appeared in search results
  • Clicks: clicks that were directly from search results
  • CTR: the click-through-rate (percentage of impressions that resulted in clicks)
  • Avg. Click Position: the average position the page was in when the link was clicked
  • Avg. Appearance Position: the average search result position for the page


Report Options

 
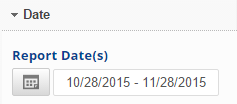
Select a custom Date Range

Date:

  • Select a report date range (the system default is the past 30 days)


General Setting Options

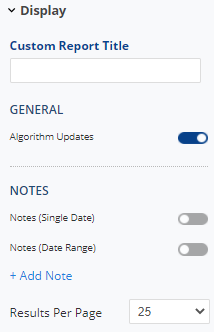
General Settings:

  • Create a Custom Report Title to be displayed above the chart. 
  • Show/Hide the Google Algorithm changes within the graph
  • Show/Hide Notes or Add Note
  • Select the number of Results you want to view per page.
Adding Events and Notes
  • Click the Apply Changes button to display the report.


Add to PDF Report


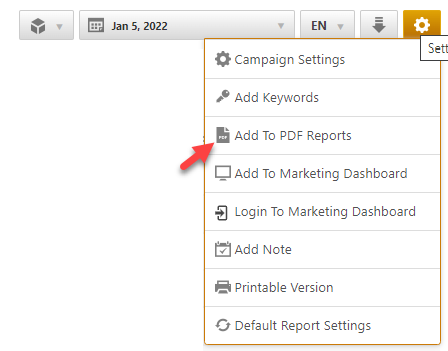
Conveniently add a report or graph with its current settings to a PDF report by hovering over the gold gear icon and selecting Add to PDF Reports

add report to PDF


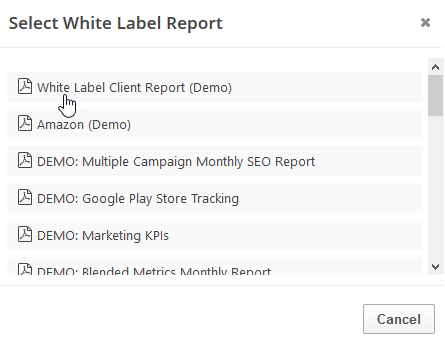
Select the PDF Report that you want the report or graph added to
             
select white label report

Drag the new report or graph into the position you want it to display in the PDF and confirm that the Date settings do not conflict with the automated scheduling settings.

Add to Marketing Dashboard


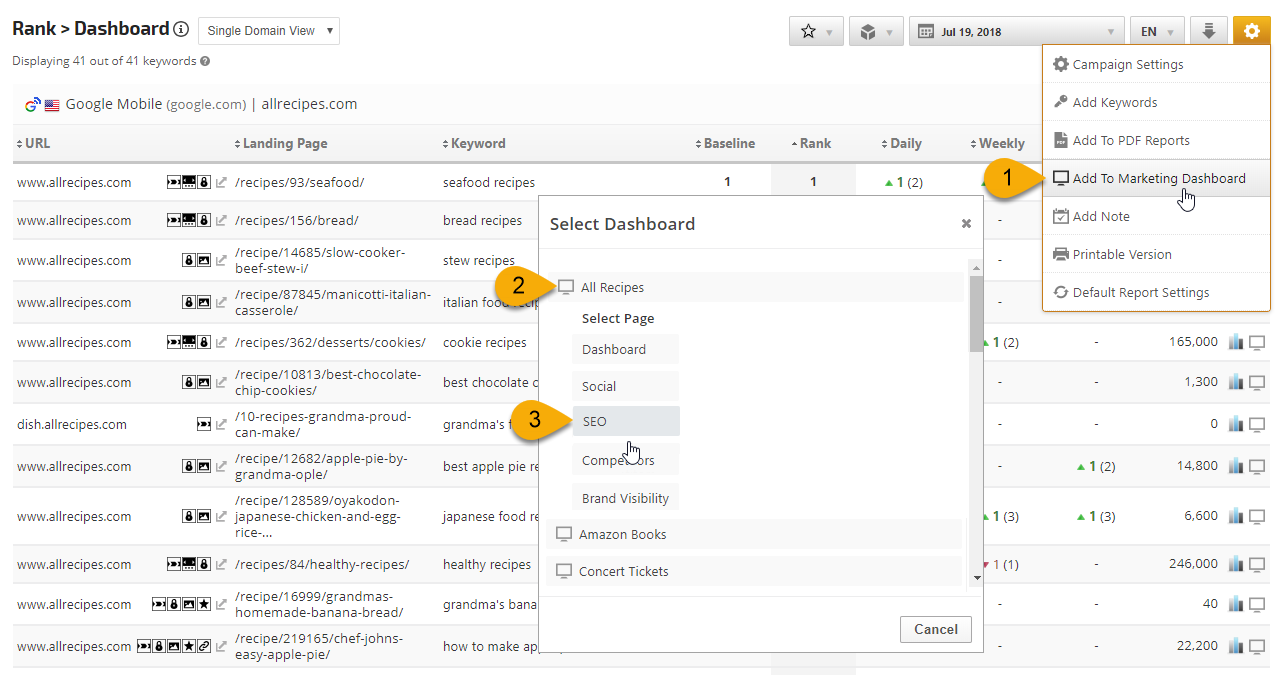
Conveniently add a report or graph with its current settings to a marketing dashboard:

1. Hover over the gold gear icon and select Add to Marketing Dashboard
2. Select the Dashboard (campaign name)
3. Select the Dashboard Page that you want the report added to


add report to PDF


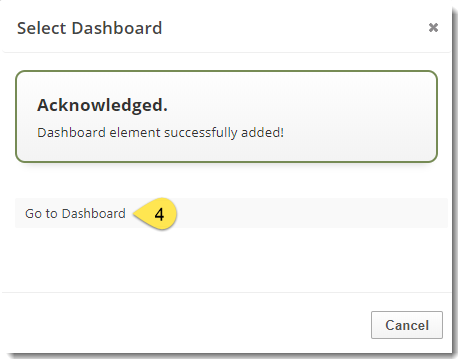
4. Click the "Go to Dashboard" link to further customize the report (e.g., drag it to a specific position on the page, change date settings, etc.)


Refer to the Report Options section for details regarding the display settings, filters and sort options available for this report.

The report date (or date range) is governed by the selected Dashboard date option: Date Selection or Fixed Periods, learn more...

  • Daily reports default to the last day of the selected period
  • Weekly and monthly reports default to 1 month of data
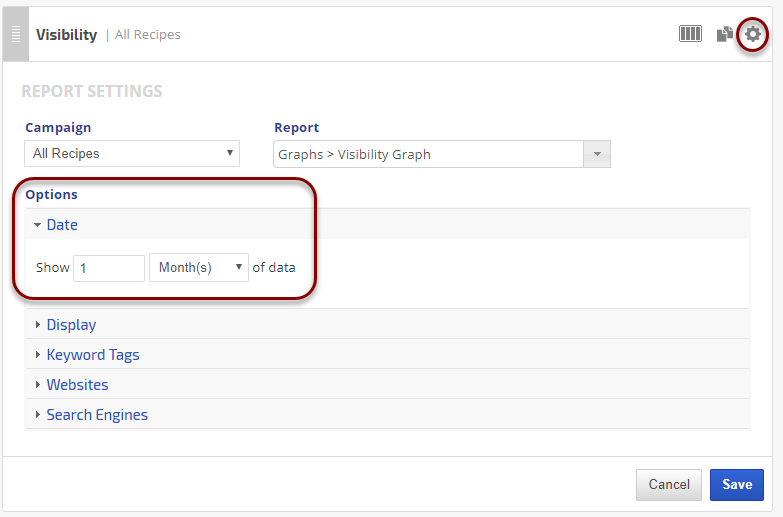
To change the number of weeks or months displayed in a specific report, click the gear icon for any marketing dashboard report element and expand the Date option section, enter the number and click the Save Button.
 
marketing dashboard report date options


Get the ultimate SEO tools with the Rank Ranger Software
Learn More About Rank Ranger