Marketing Dashboard

Revolutionizing White Label Reporting
Start Free Trial
No Credit Card Required

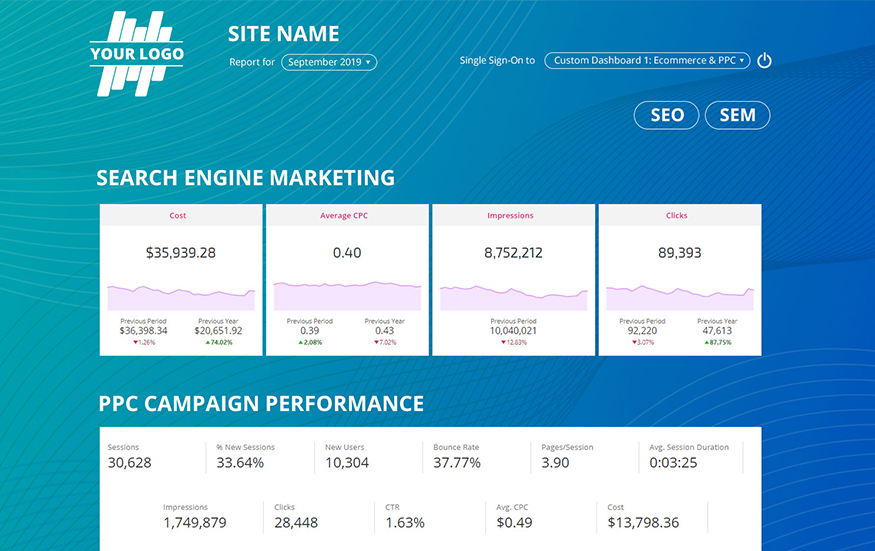
The Dashboard That Makes You Look Good While Saving Time & Money


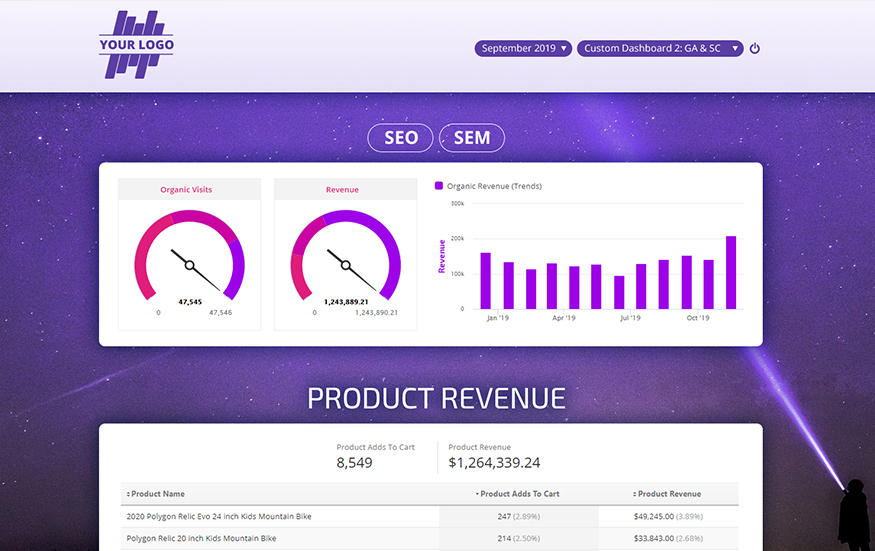
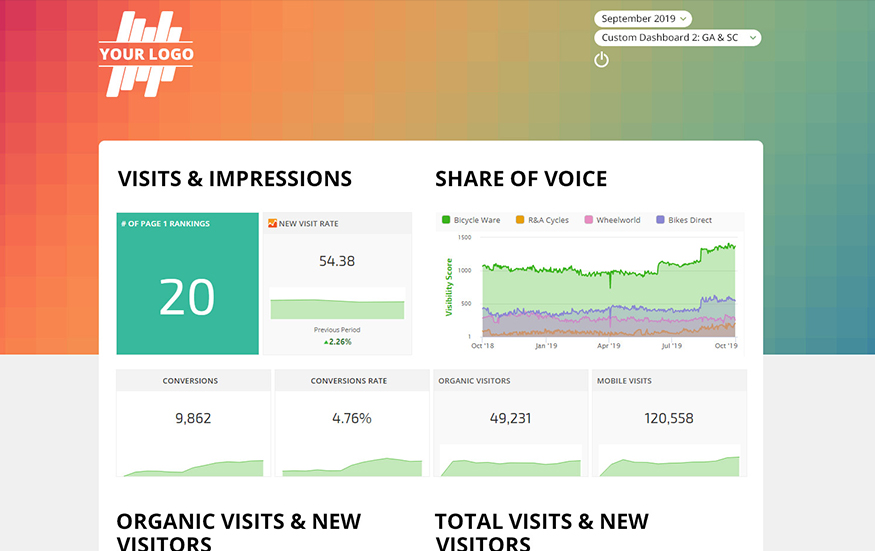
Rank Ranger's Marketing Dashboard revolutionizes how marketing and SEO firms prepare reports for their clients and upper management.

Many firms spend hours each month gathering and manipulating data from various sources and manually creating reports or uploading the data to standalone dashboard tools.

The Marketing Dashboard saves staff time by natively populating the SEO and backlink data Rank Ranger provides and seamlessly integrates data from third party sources such as Google Analytics, Search Console and social media analytics on the fly.
With all this happening behind the scenes, you can focus on how you want to present the reports instead of dealing with gathering and uploading data into a standalone dashboard.

The implications for your business are significant: you can produce sophisticated dashboards for hundreds of clients per month with little or no effort needed after the initial setup. Get Started Now

Third Party Integrations at Your Fingertips

Rank Ranger's Marketing Dashboard can integrate data from a variety of third party applications to allow for comprehensive reporting of business activity. Below are the integrations presently supported, and the list is continuously growing.
Web Analytics
Adobe Analytics Adobe Analytics
Google Analytics Google Analytics
IBM CoreMetrics IBM CoreMetrics
Social Analytics
Facebook Insights Facebook Insights
Instagram Analytics Instagram Analytics
Twitter Analytics Twitter Analytics
LinkedIn Analytics LinkedIn Analytics
YouTube Analytics YouTube Channel Analytics
Webmaster Tools
Bing Webmaster Bing Webmaster
Search Console Search Console

Call Tracking
Call Tracking Metrics Call Tracking Metrics
CallRail CallRail
Invoco Telecom Invoco Telecom
Twilio Twilio
What Converts What Converts
Email Marketing
AWeber AWeber
MailChimp MailChimp
Constant Contact Constant Contact
Ad Analytics
Google AdWords Google Ads
Bing Ads Bing Ads
Facebook Ads Manager Facebook Ads Manager
Other Integrations
Google My Business Google My Business
Yext Yext
Google Drive Google Drive
Asana Asana
WooCommerce WooCommerce
DeepCrawl DeepCrawl

Truly White Label - You Control The Branding

Rank Ranger's Marketing Dashboard is 100% white label and is also customizable to match any site's design and branding, giving you the ability to present a fully-branded, marketing KPI dashboard to your clients.
  • Access Dashboard HTML and CSS for full design control
  • Display the client's logo, your company's logo or both - you choose
  • Premium custom domain service gives you the freedom to use your own domain instead of our white label reports domain

Creating Dashboards - Creativity Made Easy

Flexible User Interface Facilitates Your Creativity


Let your creativity flow through the flexibility of design coupled with the ability to schedule messages and embed interactive content, resulting in enhanced communication of the story you want to share with your clients
Reports and graphs can be easily added to dashboards from individual reporting screens inside Rank Ranger reports or from within the dashboard builder
Drag and drop page elements to easily reorder on the page or move to a different page
Report data that already exists in Rank Ranger, simply select which reports and graphs to include and how you want them displayed

Save Time with Dashboard Templates


Choose from a variety of pre-designed dashboard templates containing reports, graphs, descriptive text boxes, and a color scheme that can easily be adjusted per dashboard
Create your own template designs using a quick select color palette or built-in HTML and CSS tools. Layout pages with reports, graphs, text, and external content. Save and reuse templates for additional marketing dashboards
Swiftly apply a template to a new dashboard and make any desired changes to logo, reports, text, colors, etc. to personalize it for each client

Built to Enhance Reporting Flexibility

marketing dashboard enhanced reporting
  • Group reports into web pages for clarity and organization
  • Built-in customizable dashboard navigation menu for pages and external links
  • Embed Google Spreadsheets, Presentations, Drawings, and Forms as well as Vimeo and YouTube videos
  • Schedule text boxes to display during various time periods anywhere you'd like in your reports
  • Page elements (text boxes, graphs, KPI widgets & more) can be sized to 1/2 or full screen width to provide report layout flexibility
  • WYSIWYG editor lets you easily customize the presentation of text, images, videos, links, tables and other elements to fit your needs

Additional Customization Options:


Customized reporting periods - the dashboard offers you the ability to provide your clients with monthly, quarterly, or yearly reports as well as the flexibility to choose custom reporting dates

Establish secure or public access - you decide whether access to a marketing dashboard will require login credentials

Choose From a Wide Selection of Reports,
Graphs & Widgets

Rank Reports (Partial List)


Rank Tracker Dashboard
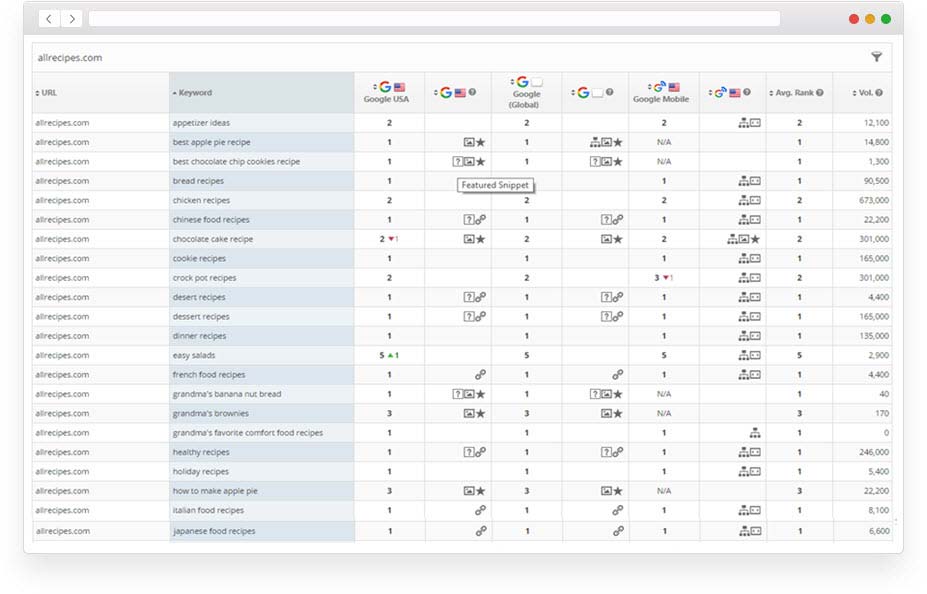
Rank Tracker Dashboard (includes competitor view) is a comprehensive daily rank report with options to view baseline rank, daily, weekly, monthly and overall rank change, landing page metrics including SERP indicators, social metrics per landing page, domain and landing page backlink metrics, search volume, Ads metrics, algorithm change and more. Built-in Google SERP snapshots reveal the top organic rank results plus related search phrases, ads, local packs, image boxes, news boxes, and other Google search features.
Search Engines
Search Engines rank report presents keyword rank for each search engine side-by-side with options for viewing SERP indicators, baseline rank, best rank, average rank and more.
Daily, Weekly & Monthly Rank Snapshots
Daily, Weekly & Monthly Rank Snapshots feature rank color scale to highlight rank trends and are loaded with options allowing you to choose the date range, specific keywords or filter by keyword tags, display annotations and much more.
Landing Page Performance
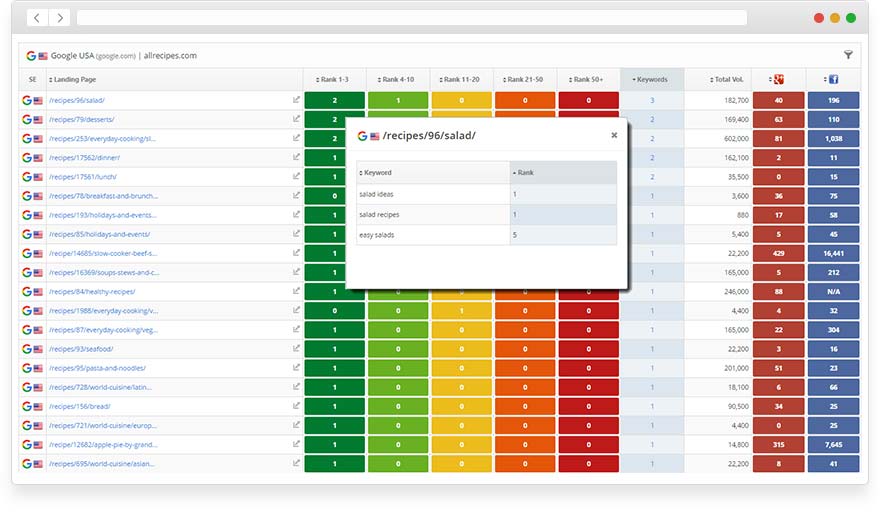
Landing Page Performance report has seven different presets that focus on keyword rank distribution, traffic stats (organic, direct, social and referral), social signals and backlink metrics and allows you the freedom to display any combination of those metrics.
Market Reach
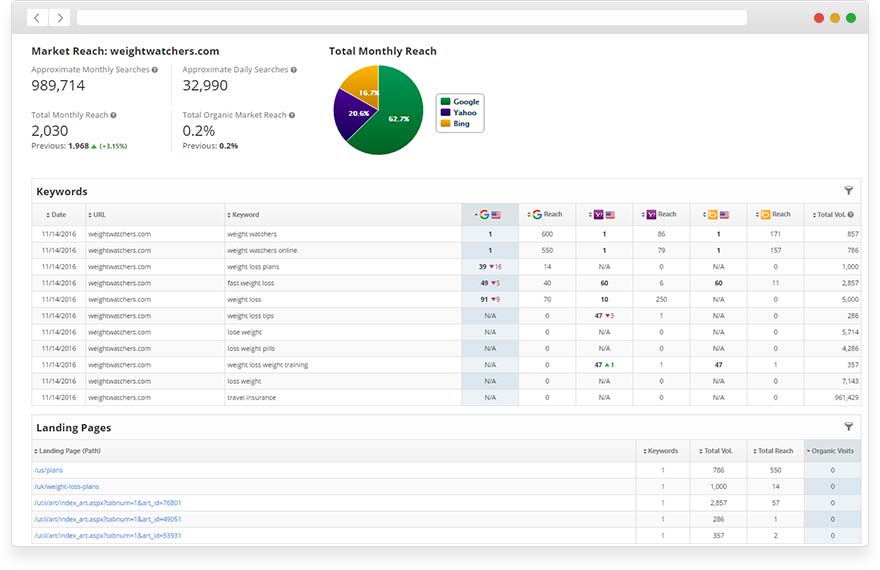
Market Reach report presents the potential market reach by search engine and the total monthly market reach for all tracked search engines providing a metric that measures the potential market value on a global scale.
Average Rank Positions
Average Rank Positions displays the average, highest and lowest rank of the keywords for the primary and/or competitor domains along with Google Ads and domain backlink metrics.
Overall Ranking Performance
Overall Ranking Performance report summarizes rank progress, comparing the keyword rank on the first day it was tracked to the rank on any specified date.

WEBSITE TRAFFIC REPORTS


Traffic Overview
Traffic Overview provides a top level summary of website traffic including traffic graphs, graphic widgets (returning vs new visitors, top channels, device overview), traffic metrics, top referrers and top keywords.
Traffic Sources
Traffic Sources provides a visually appealing summary of website traffic sources such as organic vs paid, traffic by channel, traffic volume by source and more.
Monthly Snapshot
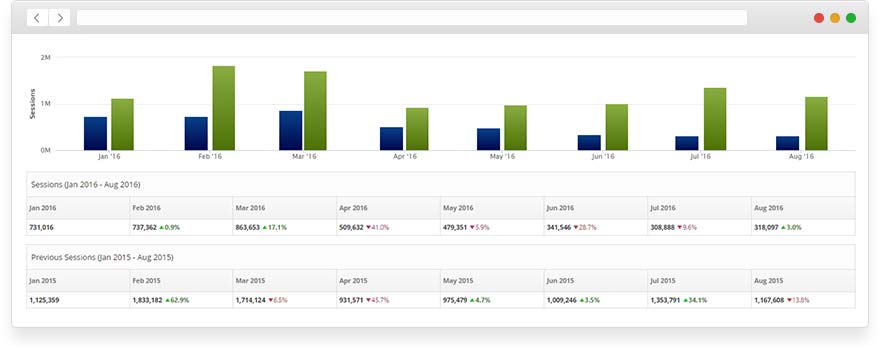
Monthly Snapshot graph details monthly traffic compared to past, with options to filter Analytics data by key metric (e.g., sessions, % new sessions, new users, etc), goals, session type, segment, and search type.
Audience GEO Location
Audience GEO Location reports present a dynamic geo-location map and comprehensive tables of traffic by country, region and city.
Audience Demographics
Audience Demographics presents graphs and tables detailing the breakdown of gender and age of website visitors.
Marketing KPI
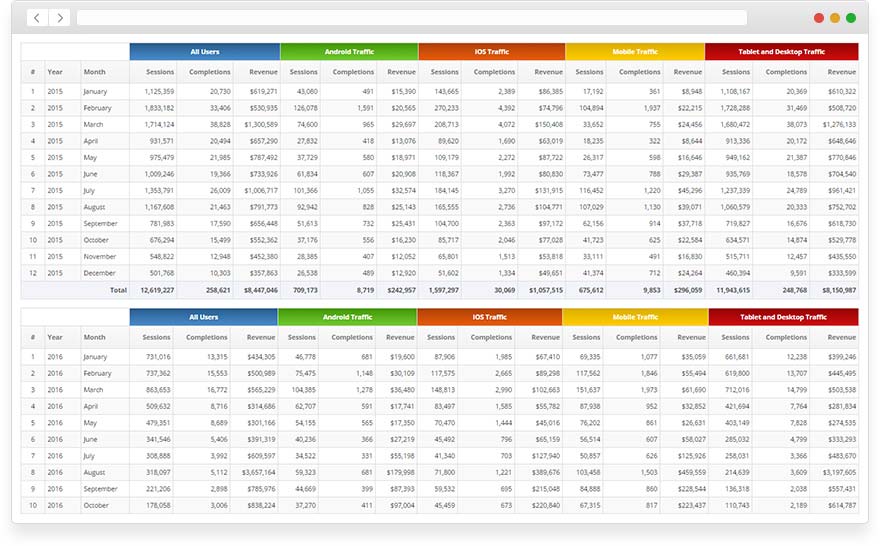
Marketing KPI is a multi-year search traffic and PPC performance analysis tool that helps you monitor and analyze trends in traffic sources, visitor behavior, goal conversions, revenue, Ads ROI and more.
Analytics Widgets
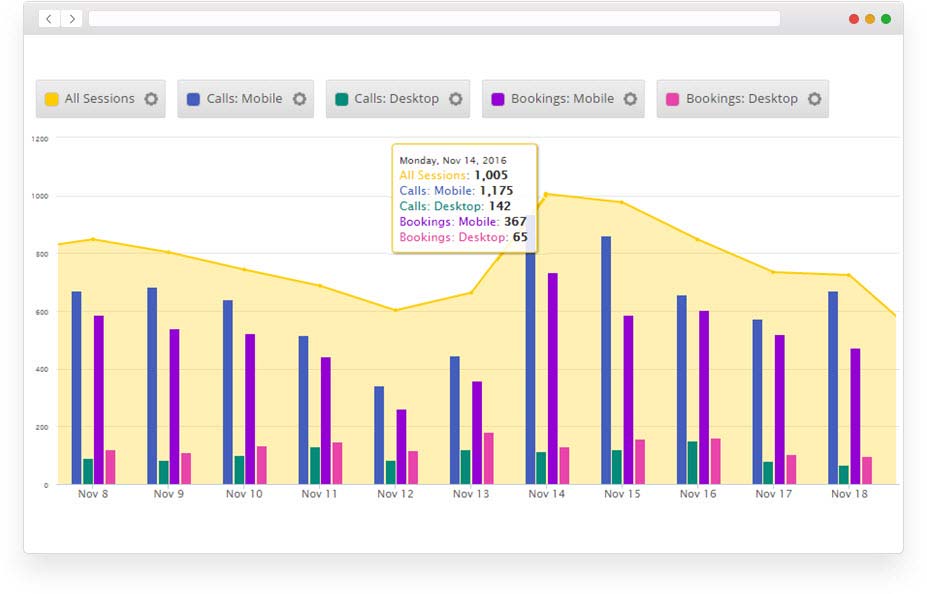
Analytics Widgets provide colorful graphic presentation of key metrics and include options with stacked columns, pie chart with list, as well as a combination traffic and rank data.
Additional Performance reports
Additional Performance reports include Conversions, Channel Grouping, Event Tracking, Top Traffic Pages, Top Traffic Keywords and Exit Pages. You can also create your own custom graphs using traffic data in our Insight Graph.

PPC REPORTS


Campaigns
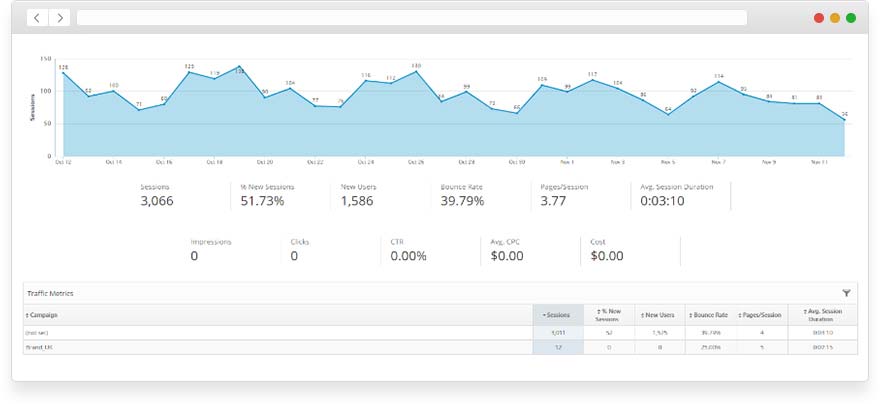
Campaigns report helps you evaluate an individual Google Ads campaign performance against other PPC campaigns, and compare time periods, to determine the effectiveness in achieving PPC traffic and goal conversions for specific segments. Includes Analytics traffic metrics and Ads metrics by PPC campaign.
Keywords
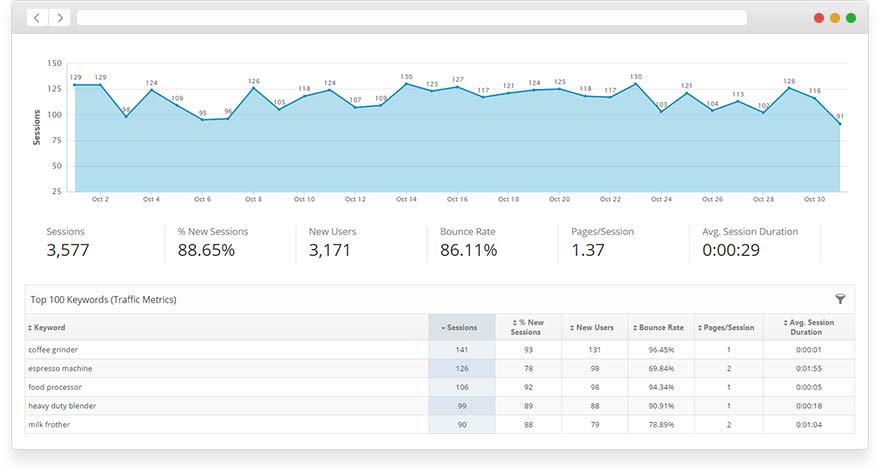
Keywords details which keywords are getting the best results in Google Ads and which are bringing in the most valuable traffic with the highest level of goal completions.
Daily Performance
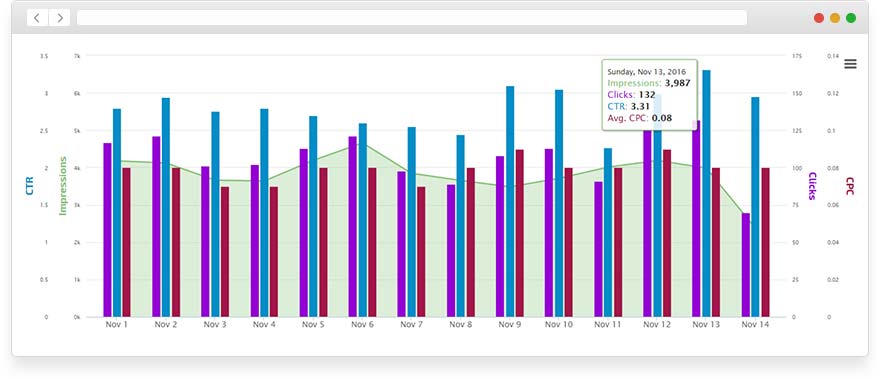
Daily Performance data includes the essential Ads metrics: clicks, impressions, CTR, Avg CPC and cost). PPC data can be viewed in a tabular report format that can be filtered to show data from specific campaigns or keywords, plotted on an Insight Graph and in Single Metric Widgets.

SEARCH CONSOLE


Search Analytics Keywords
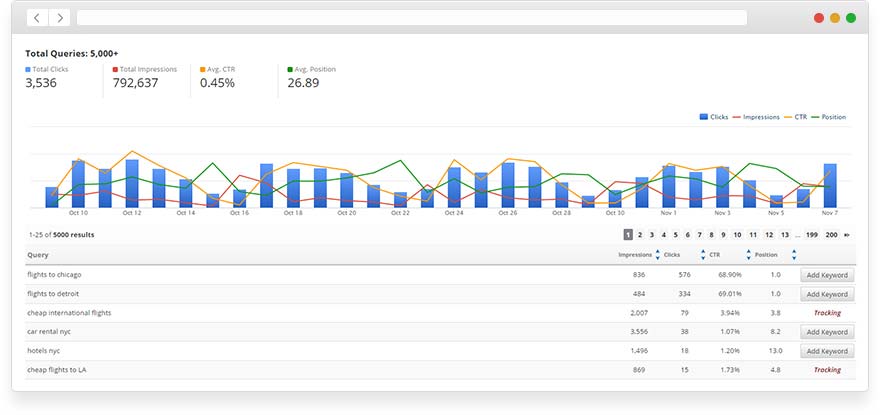
Search Analytics Keywords begins with a colorful 4-metric graph with daily clicks, impressions, CTR and Position, followed by a Summary of Totals for the report period including Queries, Clicks, Impressions, Average CTR and Average Position. A Keyword table provides the actual query keyword with its individual search metrics and a convenient button to add a keyword to your rank tracking campaign.
Search Analytics Pages
Search Analytics Pages report details which web pages are performing the best in search results by providing detailed impressions, clicks, CTR and position so you can further optimize those pages or use them as examples for SEO of other important pages on the site.

GRAPHS & WIDGETS


Insight Graphs
Insight Graphs are a powerful presentation tool that give you the creative freedom of a blank canvas with color palette, a variety of chart types and a comprehensive set of marketing performance metrics.
Single Metric Widgets
Single Metric Widgets showcase ranking stats, traffic analytics, social analytics, backlinks data and PPC metrics presented as series of colorful single metric graphs that can be used with titled separators to create a visually engaging marketing dashboard.

Move up to the New Standard Today


Rank Ranger's Marketing Dashboard sets a new standard for white label SEO and marketing reporting. It is fully branded and packed with features.

Start producing more professional and comprehensive reports in less time - and save money while you're at it.
Get Started Now