The Ads Groups analysis report provides data on the performance of Google Ads campaign groups that are connected to the same Google Analytics profile as the domain's campaign in Rank Ranger.
Report data can be filtered by Key Metric (sessions,
percentage of new sessions, new users, bounce rate, pages per session, etc.), Segment and Goal Conversion type. Goal Value can be displayed in your choice of world currencies.
Important! To view this
report Google Analytics must be configured correctly (please refer to our Google Analytics documentation) for the primary domain. In addition, Ads must be linked to your Google Analytics profile (refer to Link Google Analytics to Google Ads).
- SEO
- Rank Tracker
- Local SEO
- Mobile SEO
- Link Manager
- Landing Pages
- Social Signals
- On-Page Optimization
- Enterprise SEO Solutions
- Marketing
- Competition Analysis
- Insight Graph
- Keyword Research
- Graphs & Widgets
- Market Reach
- Marketing KPI
- Brand Visibility
- White Label SEO
- Marketing Dashboard
- Client Dashboard
- PDF Reports
- PDF Templates
- Other
- Email Notifications
- Portfolio Management
- Integrations
- Google Analytics
- Search Console
- Pay Per Click
- WeDevelop
- API
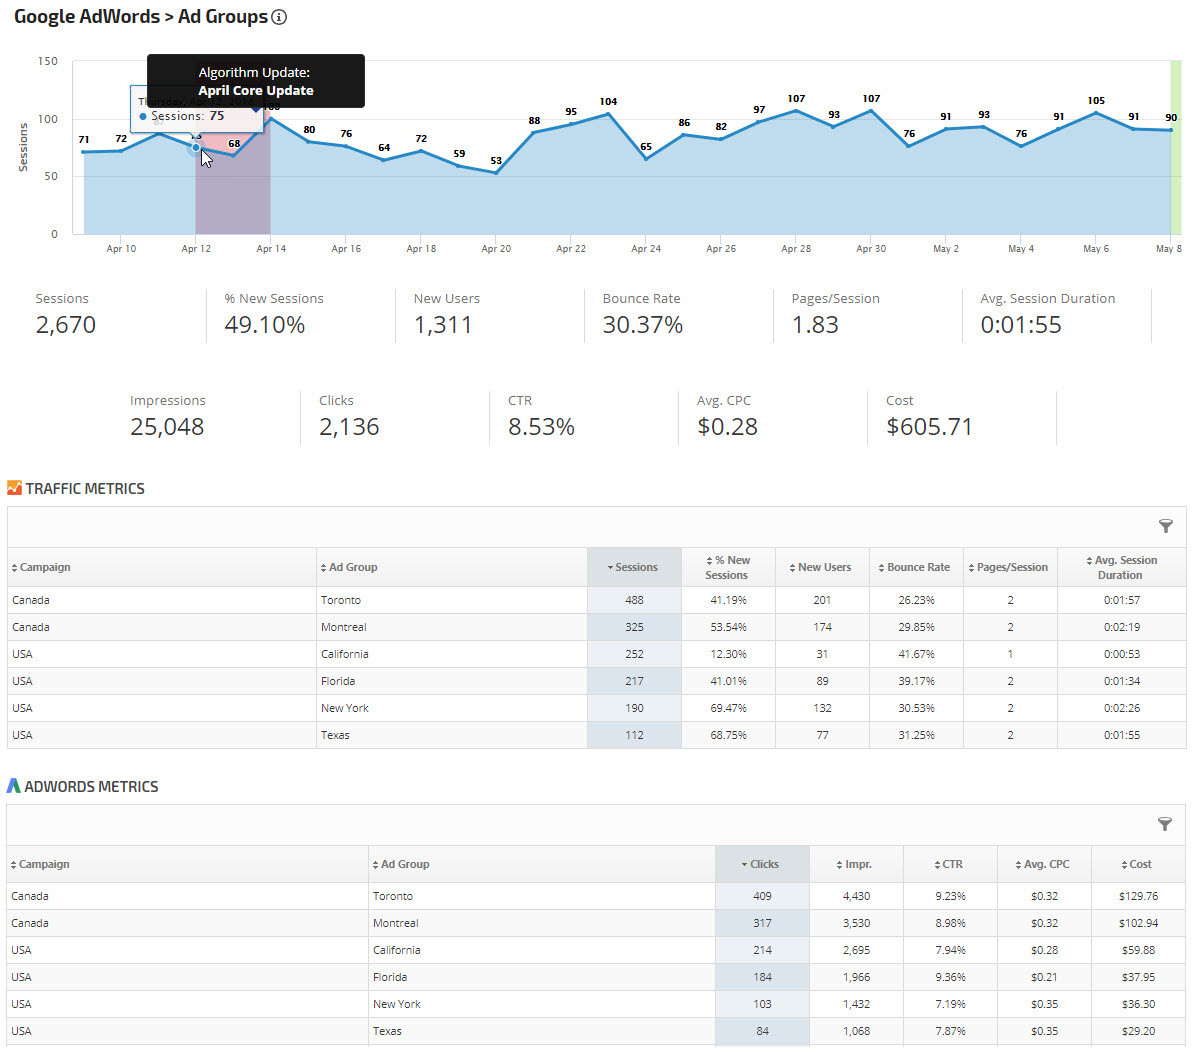
Google Ads Campaign Groups
Traffic Graph
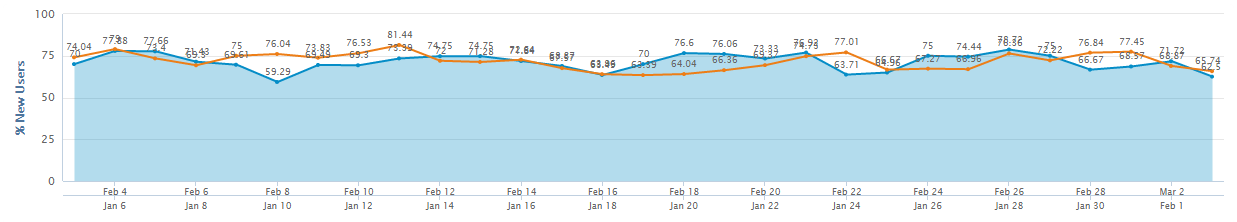
The traffic graph displays the results associated with the Key Metric you select (e.g., sessions, page views, goal completions, etc.).
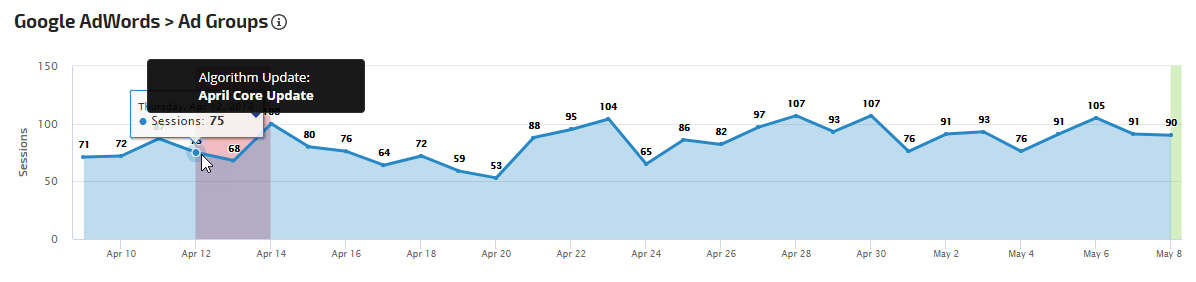
The traffic graph displays the results associated with the Key Metric you select (e.g., sessions, page views, goal completions, etc.).
Traffic Metric Totals
Enabling the Traffic Metrics Totals section presents Google Ads campaign group number of sessions, the percentage of those sessions that are new visits to the site, the number of new users visiting the site, the bounce rate, the average number of pages visited per session and the average session duration for visits to the site.

Also included are Ad impressions, clicks, CTR, Avg. CPC, and Cost
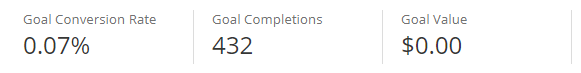
 By selecting the Conversions Display Goals in the Analytics Settings section, the Ads Goal Conversion Rate, Goal Completions and Goal Value for the selected goal (or the total, if All Goals was chosen) can be included in the report.
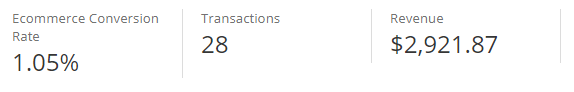
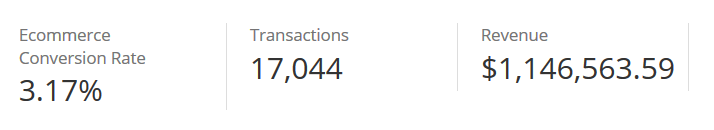
Selecting Ecommerce Transactions in the Analytics Settings section, the Conversions Display option displays the Ecommerce Conversion Rate, Transactions and Revenue instead of the Goal metrics above.
Enabling the Traffic Metrics Totals section presents Google Ads campaign group number of sessions, the percentage of those sessions that are new visits to the site, the number of new users visiting the site, the bounce rate, the average number of pages visited per session and the average session duration for visits to the site.

Also included are Ad impressions, clicks, CTR, Avg. CPC, and Cost
Selecting Ecommerce Transactions in the Analytics Settings section, the Conversions Display option displays the Ecommerce Conversion Rate, Transactions and Revenue instead of the Goal metrics above.
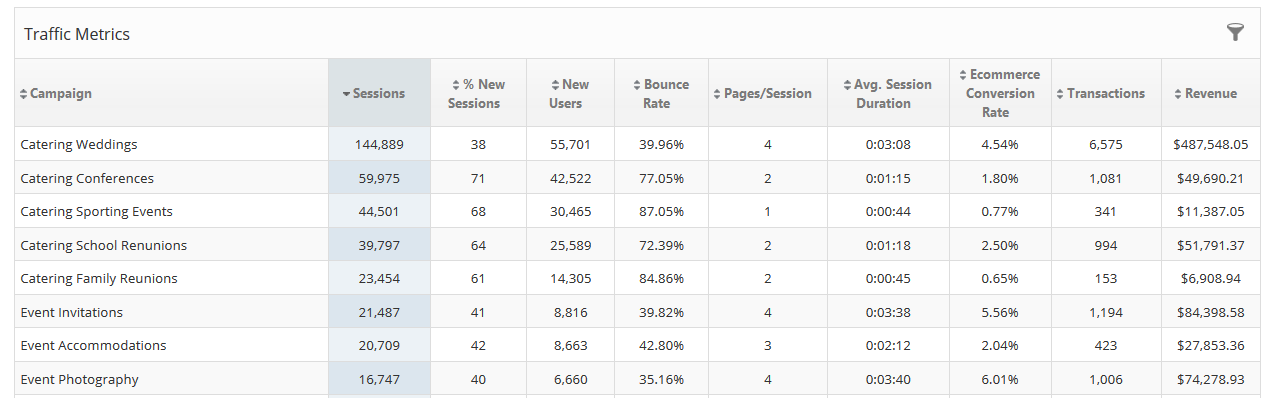
Traffic Metrics
The Traffic Metrics table displays sessions, percentage of new sessions, new users, bounce rate, pages per session, average session duration, goal conversion rate, goal completions and goal value (enable goals in Report Options > Analytics Settings) per campaign group. Note that in the bounce rate column, a lower number indicates a better rate, therefore, the downward arrow is green and represents a positive change.
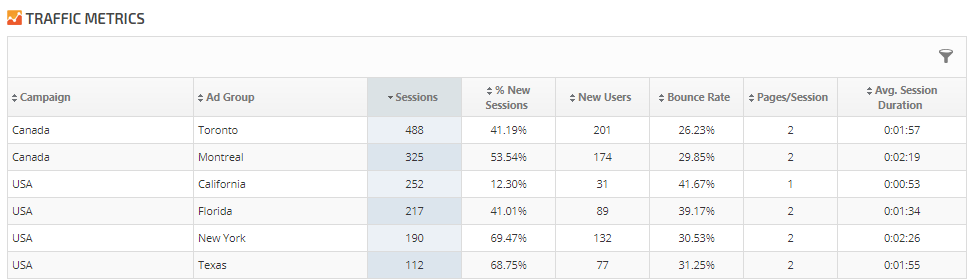
The Traffic Metrics table displays sessions, percentage of new sessions, new users, bounce rate, pages per session, average session duration, goal conversion rate, goal completions and goal value (enable goals in Report Options > Analytics Settings) per campaign group. Note that in the bounce rate column, a lower number indicates a better rate, therefore, the downward arrow is green and represents a positive change.
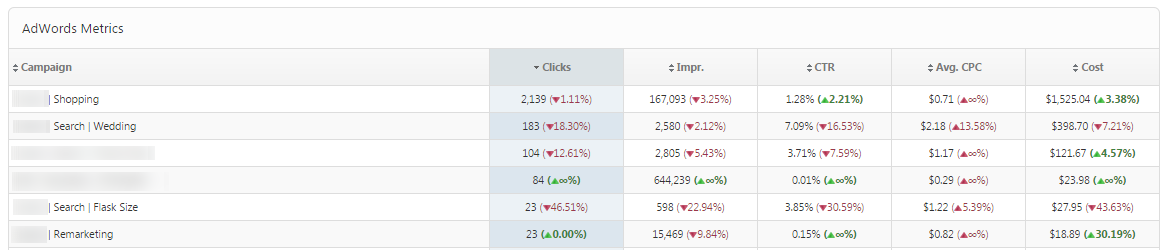
Google Ads Metrics
The Ads Metrics table displays clicks, impressions, CTR (click through rate), Average CPC (cost per click) and Cost per campaign group.
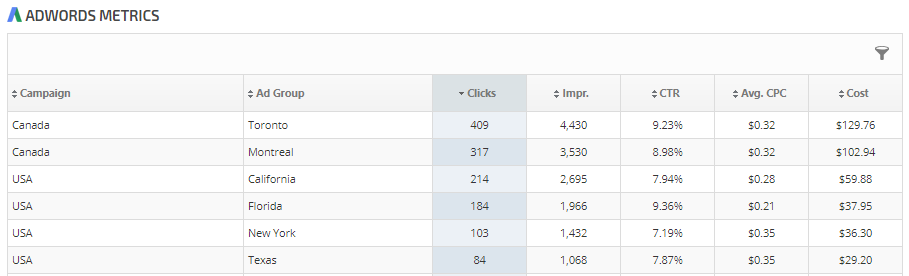
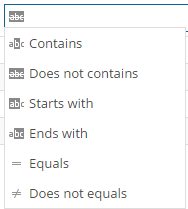
The tables can also be filtered, which allows the user to narrow down what is shown within the table.
The Ads Metrics table displays clicks, impressions, CTR (click through rate), Average CPC (cost per click) and Cost per campaign group.
Google Ads Campaigns with Ecommerce Transaction Data
When the report is filtered by Ecommerce transactions, the Ads campaign metrics include Ecommerce Conversion Rate, Transactions and Revenue.
When the report is filtered by Ecommerce transactions, the Ads campaign metrics include Ecommerce Conversion Rate, Transactions and Revenue.
The tables can also be filtered, which allows the user to narrow down what is shown within the table.
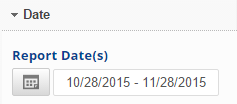 |
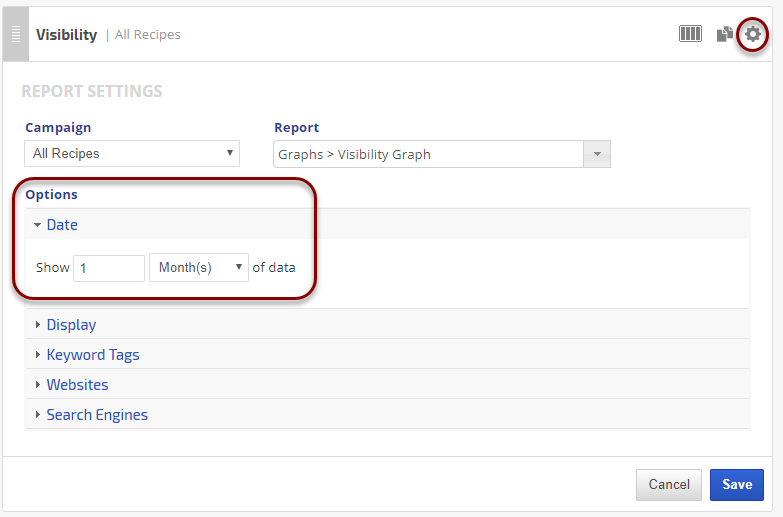
Dates
|
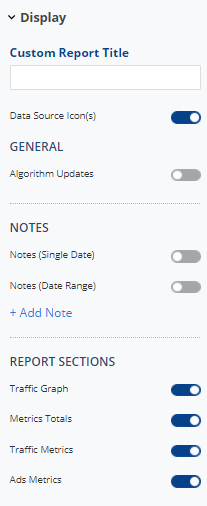 |
Display Settings
Notes
Show or Hide Report Sections
|
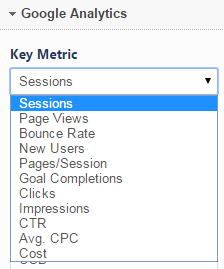 |
Select the Google Analytics Key Metric
|
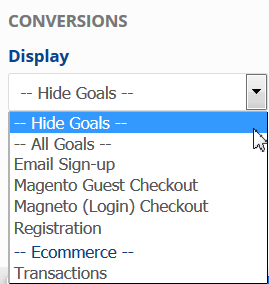 |
Select Conversions Type
|
 |
Ecommerce Currency
|
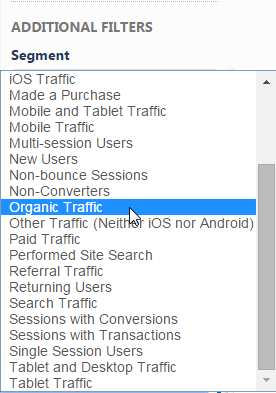 |
Select a Segment
|
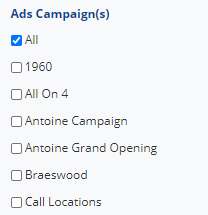 |
Filter by Ads Campaign(s)
|
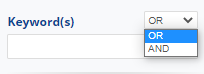 |
Filter by Keyword
|
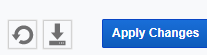 |
Click the Apply Changes button. |
Google Analytics API limits the number of requests from an IP address for a domain each day. If you see a screen in our Analytics section that displays titles but no data, it could be that you/your team have exceeded that threshold by multiple rechecks. Logging in from a different IP address or waiting until the next day should resolve the issue. Please contact us if the issue is not resolved within 24 hours.
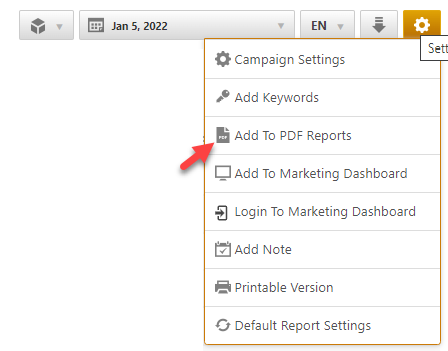
Add to PDF Report
Conveniently add a report or graph with its current settings to a PDF report by hovering over the gold gear icon and selecting Add to PDF Reports
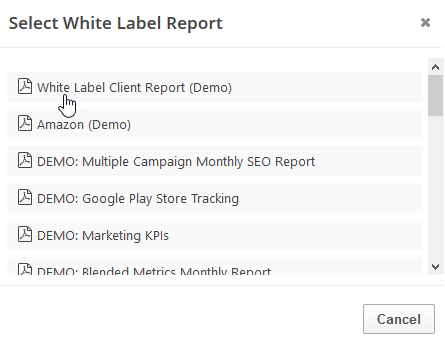
Select the PDF Report that you want the report or graph added to
Drag the new report or graph into the position you want it to display in the PDF and confirm that the Date settings do not conflict with the automated scheduling settings.
Add to Marketing Dashboard
Conveniently add a report or graph with its current settings to a marketing dashboard:
1. Hover over the gold gear icon and select Add to Marketing Dashboard
2. Select the Dashboard (campaign name)
3. Select the Dashboard Page that you want the report added to

1. Hover over the gold gear icon and select Add to Marketing Dashboard
2. Select the Dashboard (campaign name)
3. Select the Dashboard Page that you want the report added to
4. Click the "Go to Dashboard" link to further customize the report (e.g., drag it to a specific position on the page, change date settings, etc.)

Refer to the Report Options section for details regarding the display settings, filters and sort options available for this report.
The report date (or date range) is governed by the selected Dashboard date option: Date Selection or Fixed Periods, learn more...
- Daily reports default to the last day of the selected period
- Weekly and monthly reports default to 1 month of data