Search our Knowledge Base
Search

Site Audit Pages Report


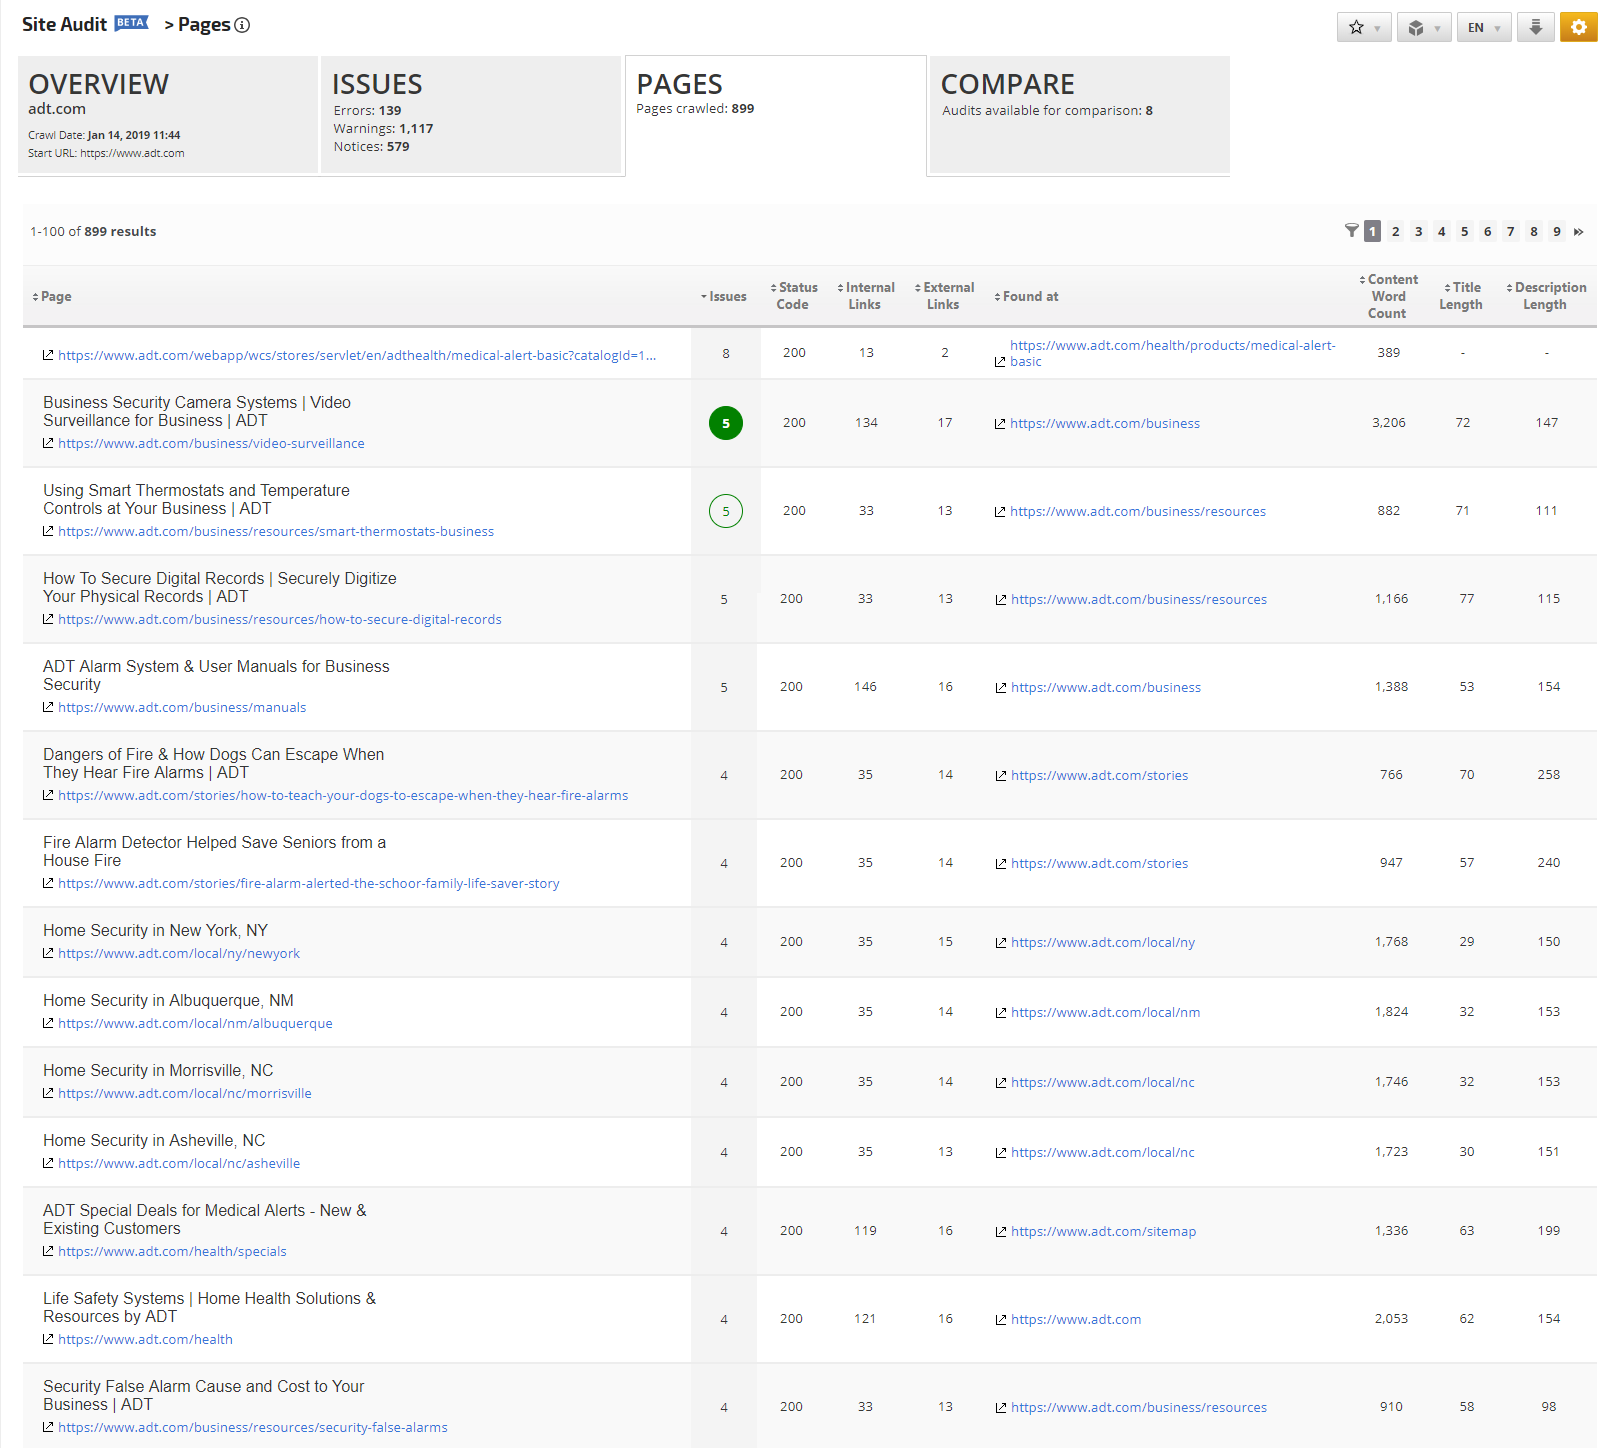
The Site Audit Pages report provides a status summary of the pages that were crawled during the audit.  The report features options for the display of a variety of fields and filters for specific issues.

The issues displayed in this document represent a sampling of the potential issues that may be found in the results of a site audit.

Site Audit Pages report
Located in Reports  & Tools > Organic Search > SEO Audit
 

Website Pages Audit


This report has more than 20 field options to choose from for display, and 40+ issue filters to allow for deep analysis and resolution of issues.
Clicking a link in the Page column launches the individual detailed page audit.   

Audit of Site Pages


Page Audit Checklist


Marking Work as Completed
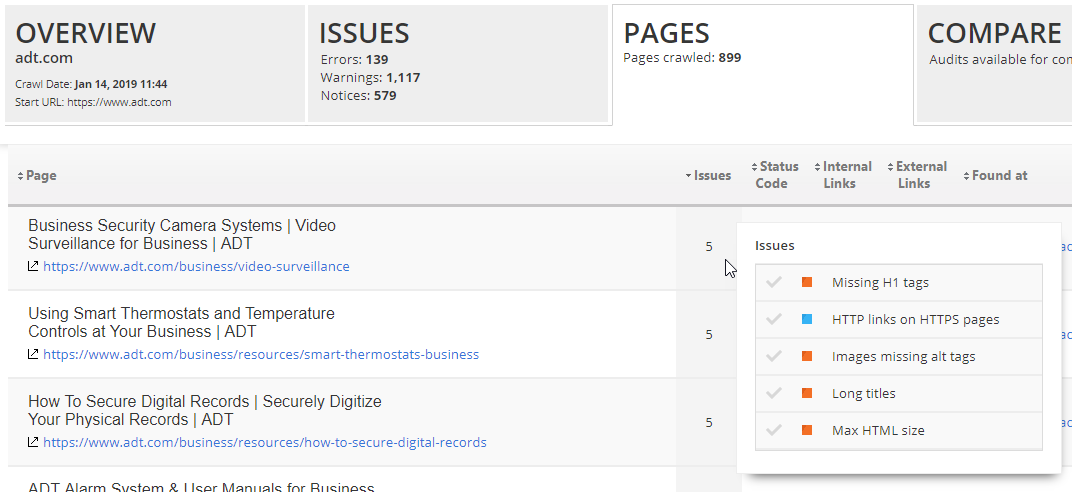
The Pages report can act as your checklist for page issues work. Hovering over the number in the Issues column displays a checklist of issues found during the Site Audit, clicking a checkmark for an issue turns the check green to indicate that item has been completed.

site audit pages issue status

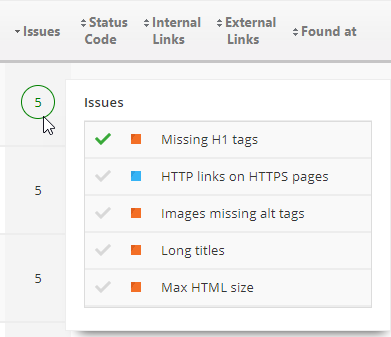
Page Issues Partially Resolved
When a page has more than one issue and not all have been resolved, then the number of issues is outlined by a green circle.  

page issues partially resolved

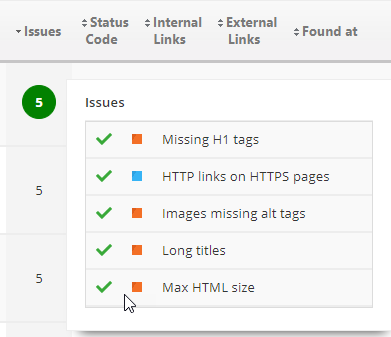
Page Issues Completely Resolved
When all issues have been checked as completed, the number of Issues reported during the site audit is displayed in a solid green circle. 

page issues resolved


Individual Page Audit Report


Detailed status and issue report for a specific web page.

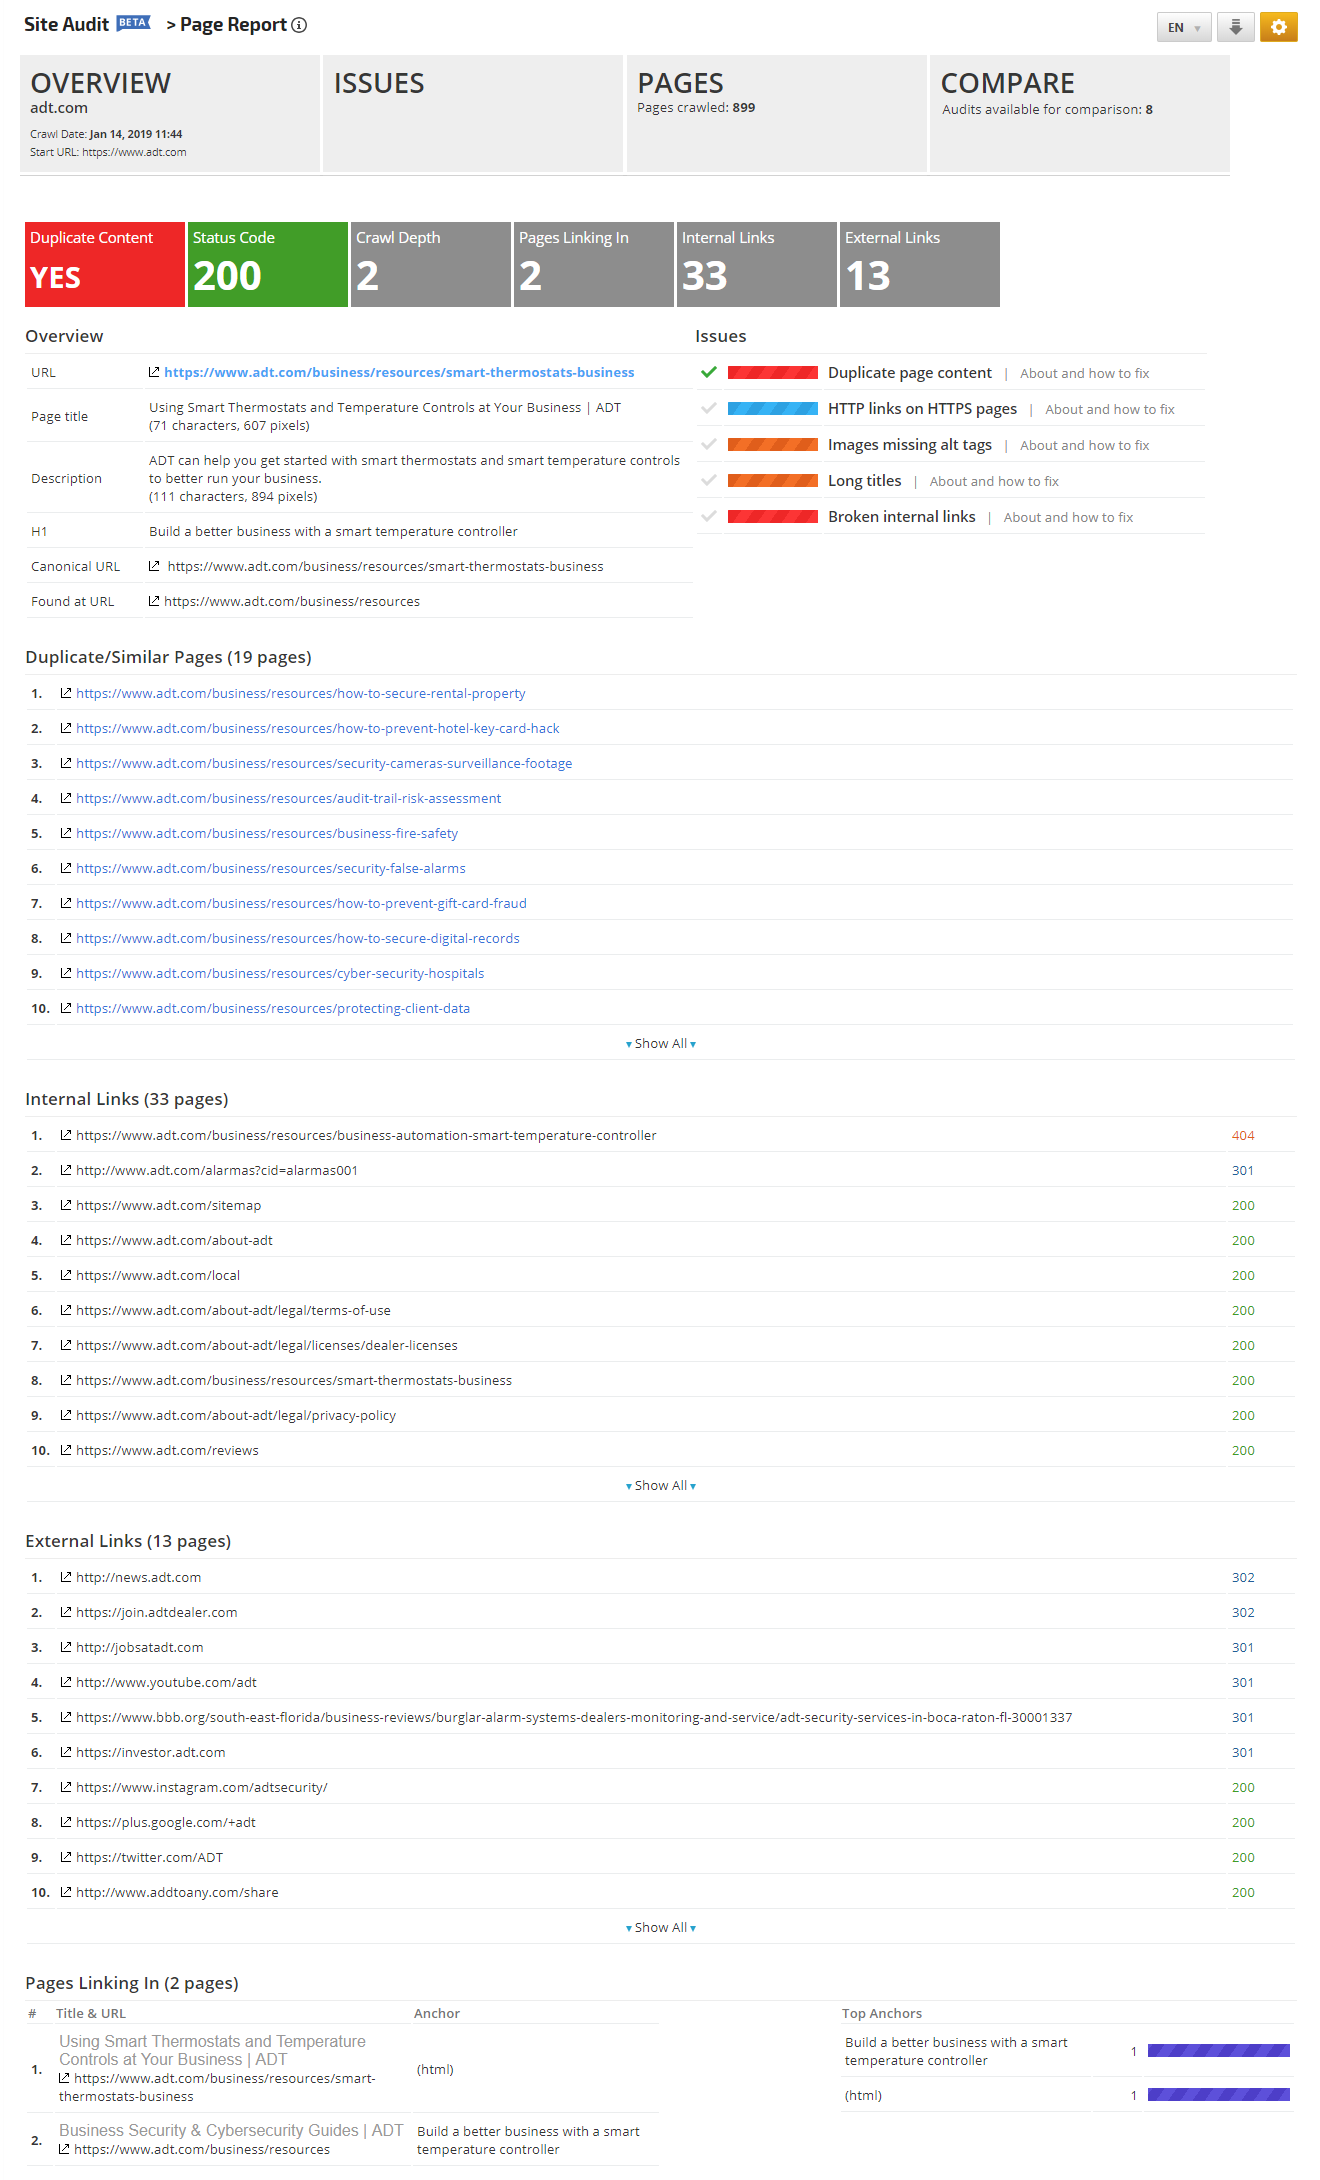
Site Page Report of issues


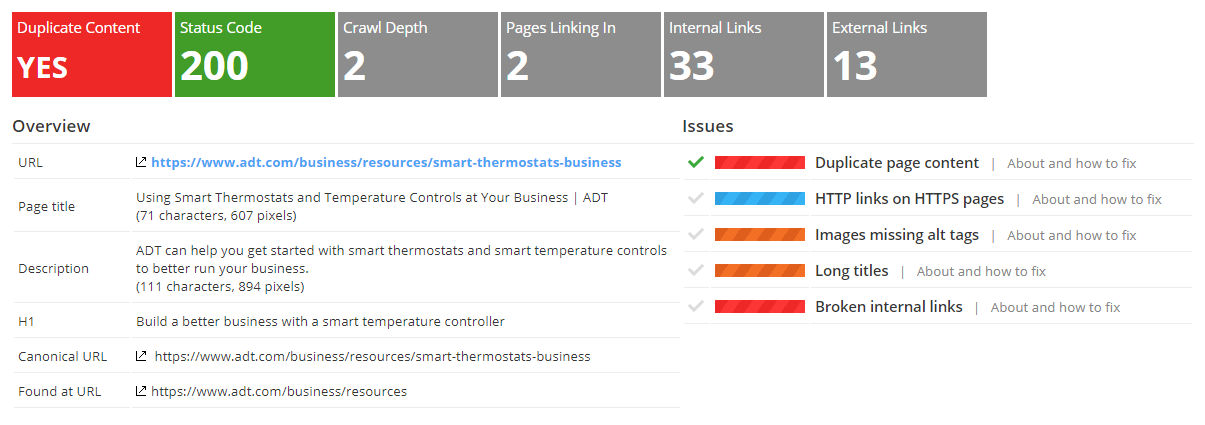
Overview of Page Audit Status


This section provides a summary of the audit of an individual site page. When you've resolved an issue, you can click on the gray checkmark and it will turn green, providing you with a visual issue status list (doing so also updates the Pages report status).

Overview of Page audit status


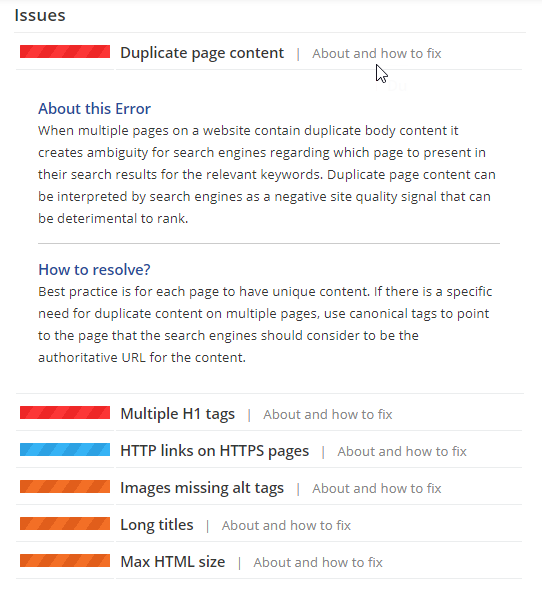
Page Issues


Errors (red), Warnings (orange), and Notices (blue) are listed in the Issues section. Click the "About and hot to fix" link for any issue to learn more about what it means and what steps you might take to resolve it.

Page Issues


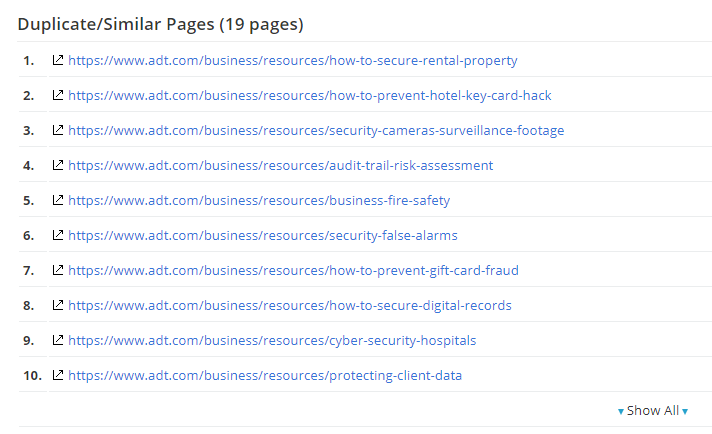
Duplicate or Similar Pages


This is an example of one of the many types of issues that may display in this report. Clicking the link opens the Page report for the page that the audit determined contains duplicate or similar content. 

duplicate or similar pages


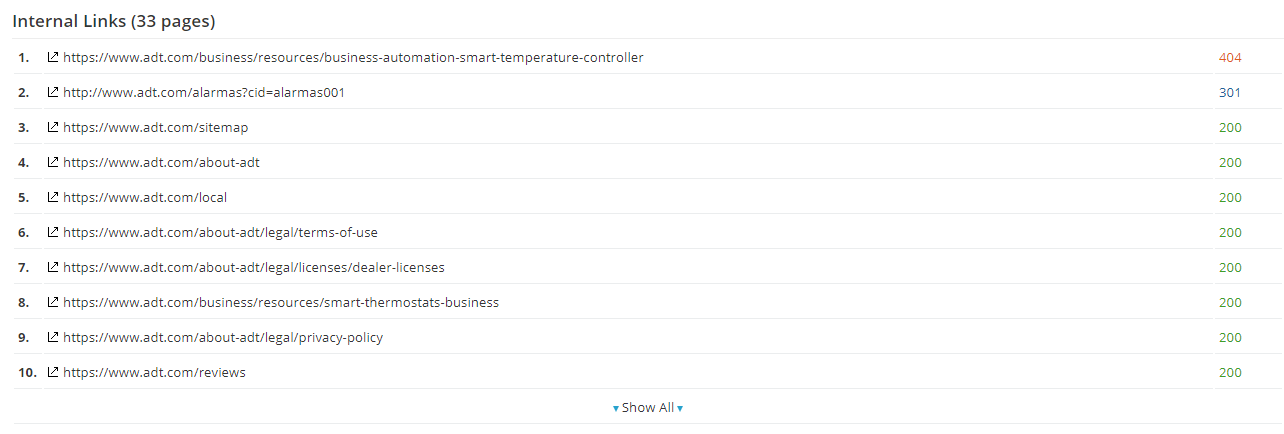
Internal Links


This section lists 10 internal links that exist on the audited page, along with their HTTP status code. Click the Show All option at the bottom of the table to display the full list. Clicking the launch link opens the web page in a new tab.
         
Internal Links


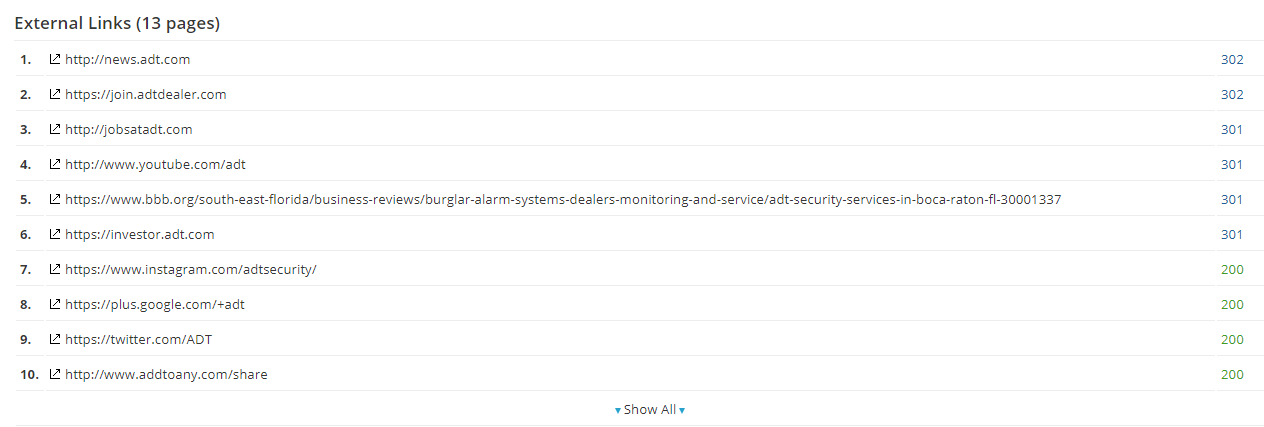
External Links


This section provides a list of 10 external links that appear on the audited page, along with their HTTP status code (errors are displayed in red).  To view more than 10 links, click the Show All option at the bottom of the table. Clicking the launch icon causes the URL to open in a new tab. 
External Links


Pages Linking In


A list of the site pages that link to the audited page are detailed in this section, along with anchor type and text.  Clicking the launch icon opens the page in a new tab.
 
Pages Linking In


Pages Schema Markup


Schema Markup is now a part of a Site Audit report in two sections.
  • Table column where the type of Schema Markup displayed: Person, Article, How-To, and more. To show the column in the table of Page reports refers to the Display options below.

  • site audit pages issue status
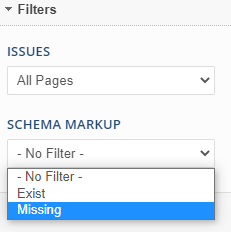
  • Filter Schema Markup which gives an ability to Filter by Missing or Existing Schema Markup on crawled pages. For the details refer to the Filter Options below.

Pages Report Options


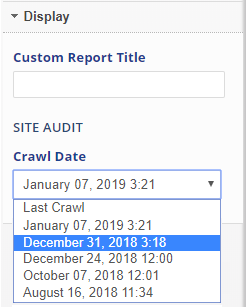
crawl date

Display

 
  • Select a Crawl Date
display fields

Display Fields

 
Select the columns you want to be displayed in the report:
  • Broken Links
  • Code to Text Ratio
  • Content Encoding
  • Content Type
  • Content Word Count
  • Crawl Depth
  • Deprecated Tags
  • Description Length
  • Duplicate Content
  • Duplicate Description
  • Duplicate H1
  • Duplicate Title
  • External Links
  • Fetch Time
  • Final URL
  • Found at
  • H1 Length
  • Host
  • Internal Links
  • Protocol
  • Redirect Hops
  • Schema Markup
  • Status Code
  • Title Length
  • URL Length
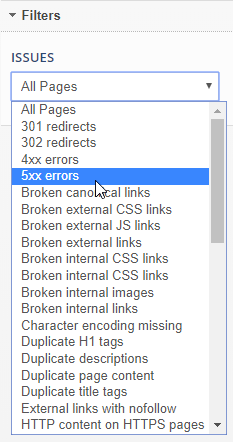
report filters

Filters

 
Select All or a specific issue to filter the report by 
  • All Pages
  • 301 redirects
  • 302 redirects
  • 4xx errors
  • 5xx errors
  • Broken canonical links
  • Broken external CSS links
  • Broken external JS links
  • Broken external links
  • Broken internal CSS links
  • Broken internal CSS links
  • Broken internal images
  • Broken internal links
  • Character encoding missing
  • Duplicate descriptions
  • Duplicate H1 tags
  • Duplicate page content
  • Duplicate title tags
  • External links with nofollow
  • High total links
  • HTTP content on HTTPS pages
  • HTTP links on HTTPS pages
  • Images missing alt tags
  • Internal links with nofollow
  • Long descriptions
  • Long titles
  • Max external links
  • Max HTML size
  • Max URL length
  • Meta refresh tags
  • Missing descriptions
  • Missing doctype
  • Missing H1 tags
  • Missing title tags
  • Multiple canonicals on page
  • Multiple H1 tags
  • No viewport tags
  • No www resolution
  • Noindex by meta tags
  • Pages blocked by X-Robots-Tag
  • Redirect chains
  • Redirect loops
  • Robots.txt not found
  • Short descriptions
  • Short titles
  • Slow pages
  • Thin content
  • Uncompressed pages
report filters Select Existing or Missing Schema Markup for the crawled pages
Or leave at No Filter to display the entire list of pages

Click the Apply Changes button to update the report view with the selected options.


Add to PDF Report


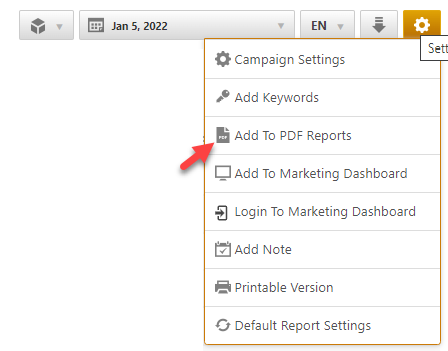
Conveniently add a report or graph with its current settings to a PDF report by hovering over the gold gear icon and selecting Add to PDF Reports

add report to PDF


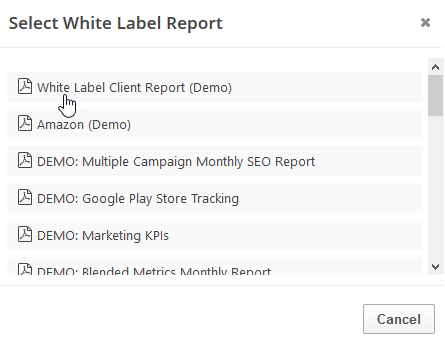
Select the PDF Report that you want the report or graph added to
             
select white label report

Drag the new report or graph into the position you want it to display in the PDF and confirm that the Date settings do not conflict with the automated scheduling settings.

Add to Marketing Dashboard


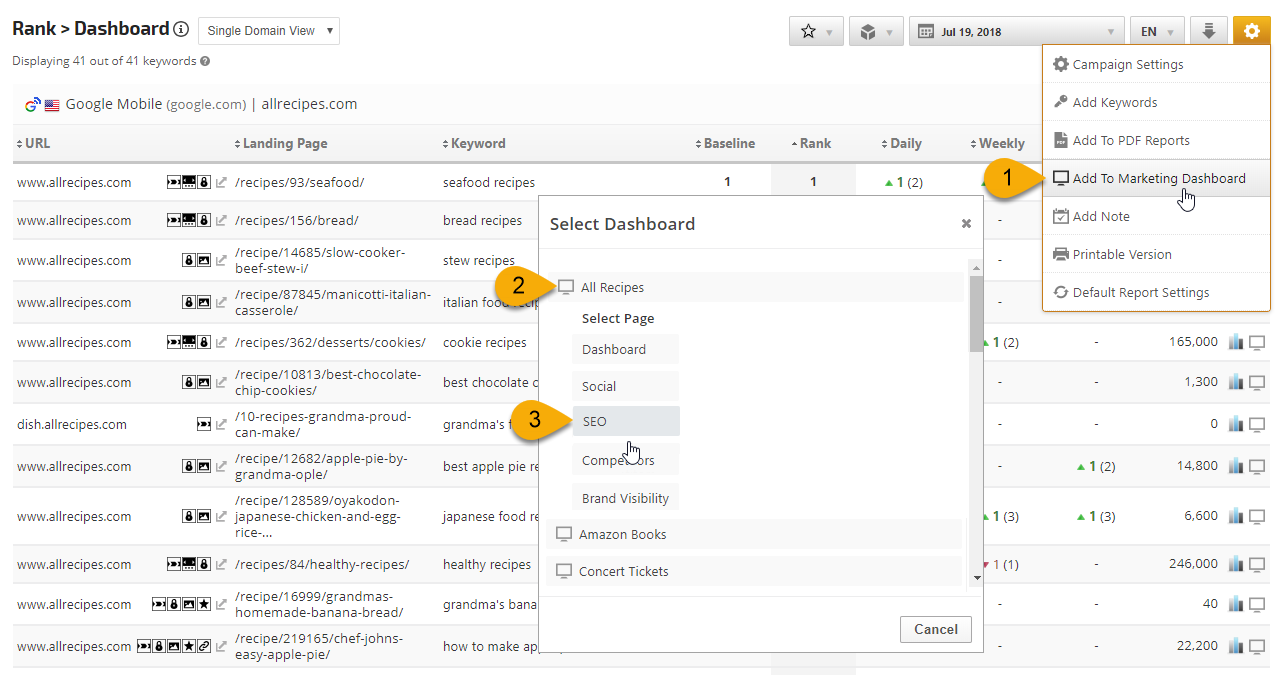
Conveniently add a report or graph with its current settings to a marketing dashboard:

1. Hover over the gold gear icon and select Add to Marketing Dashboard
2. Select the Dashboard (campaign name)
3. Select the Dashboard Page that you want the report added to


add report to PDF


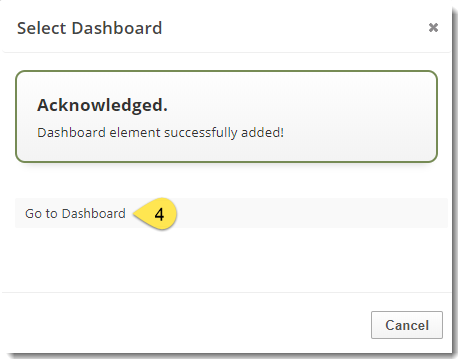
4. Click the "Go to Dashboard" link to further customize the report (e.g., drag it to a specific position on the page, change date settings, etc.)


Refer to the Report Options section for details regarding the display settings, filters and sort options available for this report.

The report date (or date range) is governed by the selected Dashboard date option: Date Selection or Fixed Periods, learn more...

  • Daily reports default to the last day of the selected period
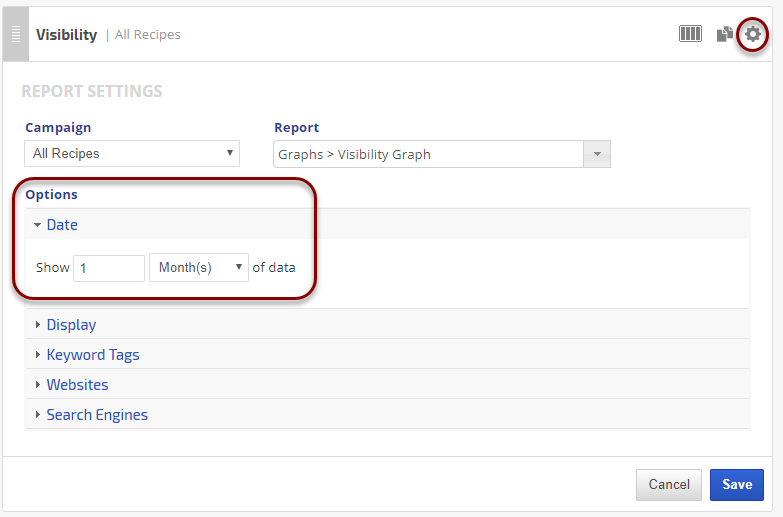
  • Weekly and monthly reports default to 1 month of data
To change the number of weeks or months displayed in a specific report, click the gear icon for any marketing dashboard report element and expand the Date option section, enter the number and click the Save Button.
 
marketing dashboard report date options


Get the ultimate SEO tools with the Rank Ranger Software
Learn More About Rank Ranger