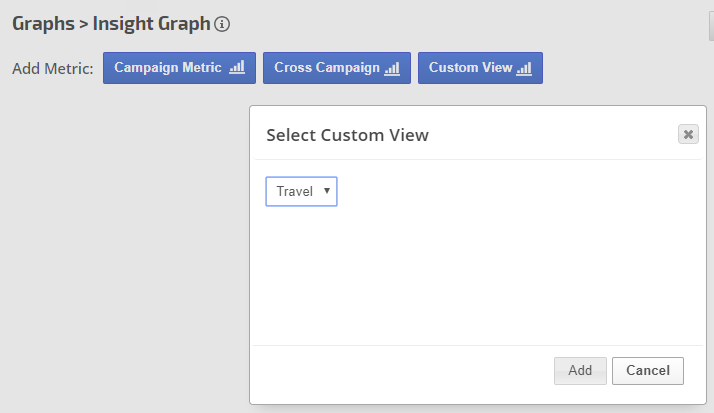
Three categories of metrics are available in the Insight Graph:
- Campaign Metric: this allows data only from the campaign it is being created in
- Cross Campaign Metric (Enterprise only feature): this allows data from any account campaign
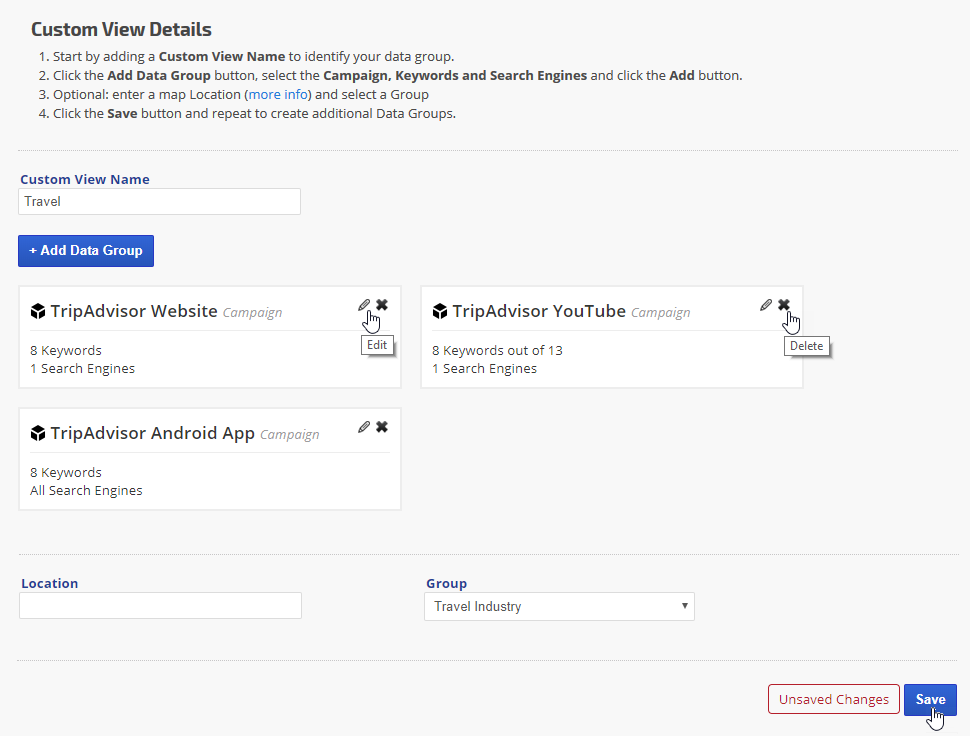
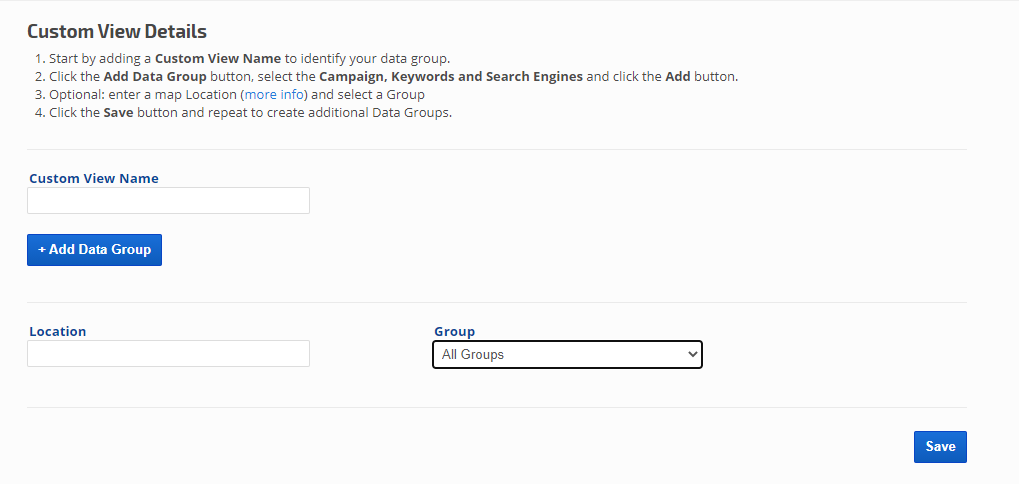
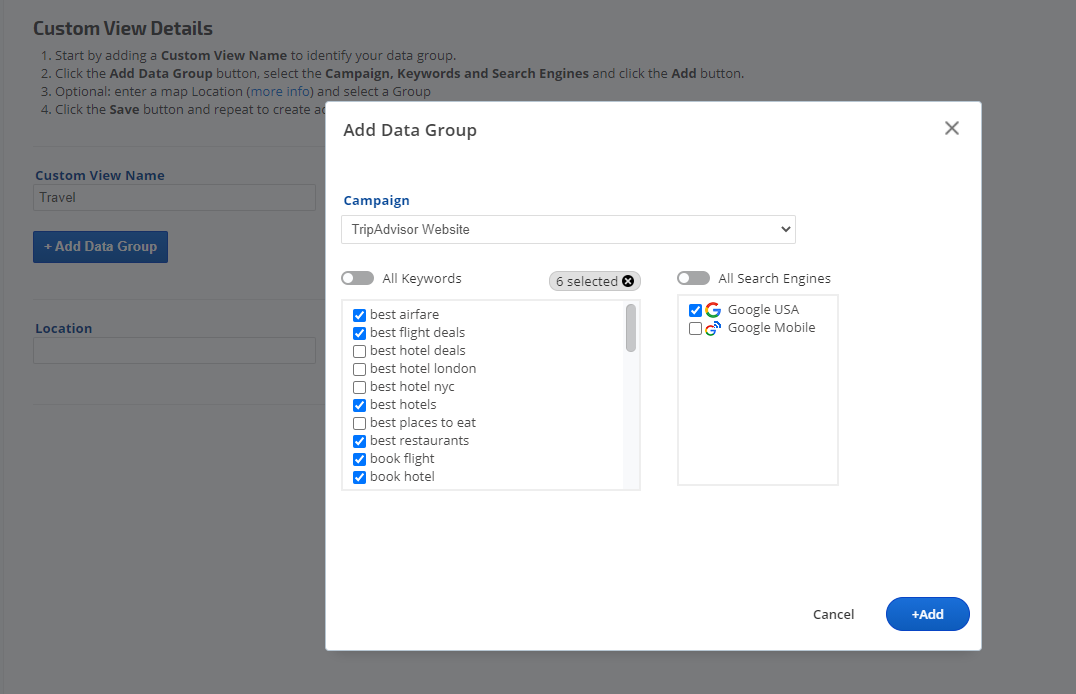
- Custom View Metric: this allows data from multiple campaigns to be aggregated (learn more...)

Add Custom View Metric
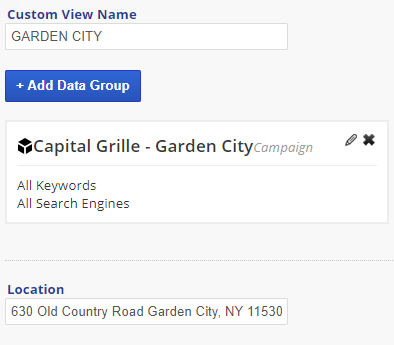
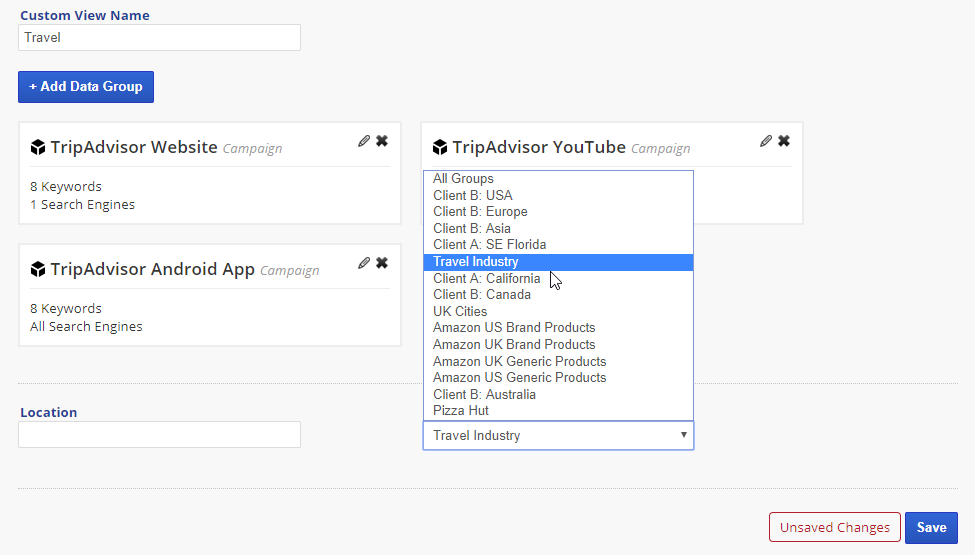
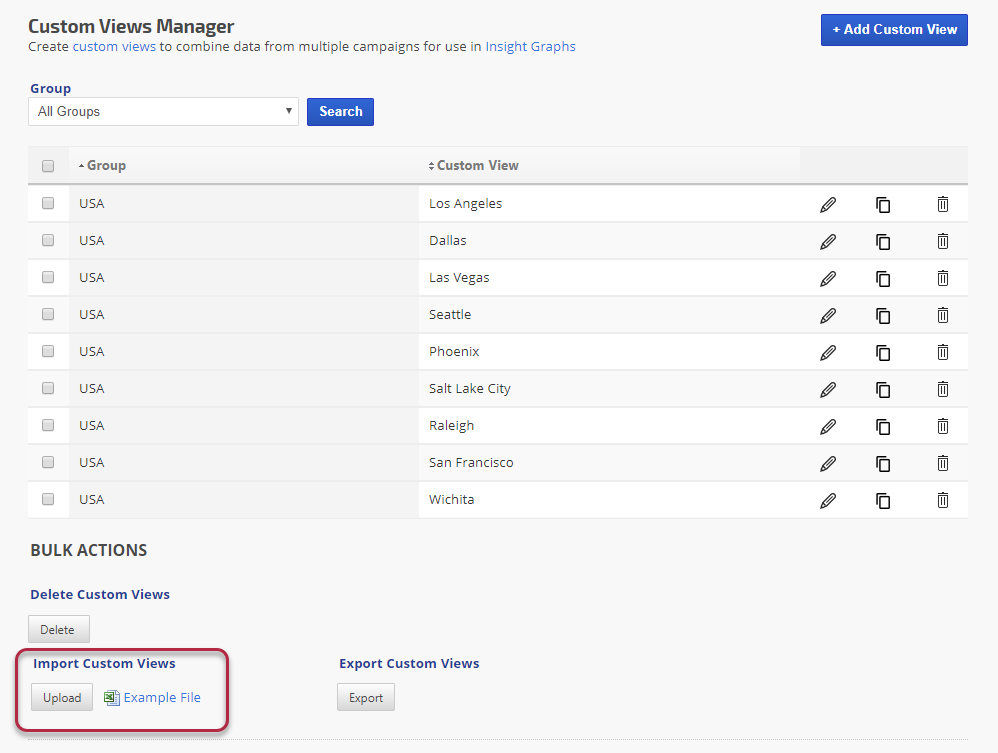
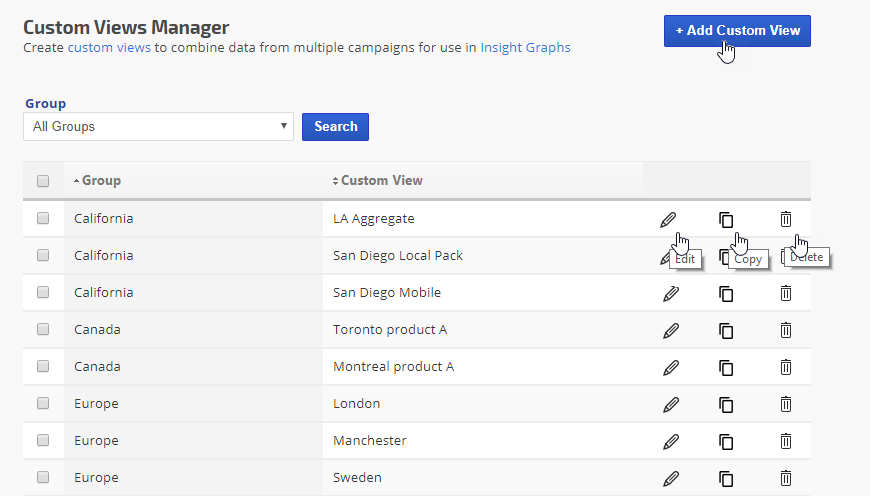
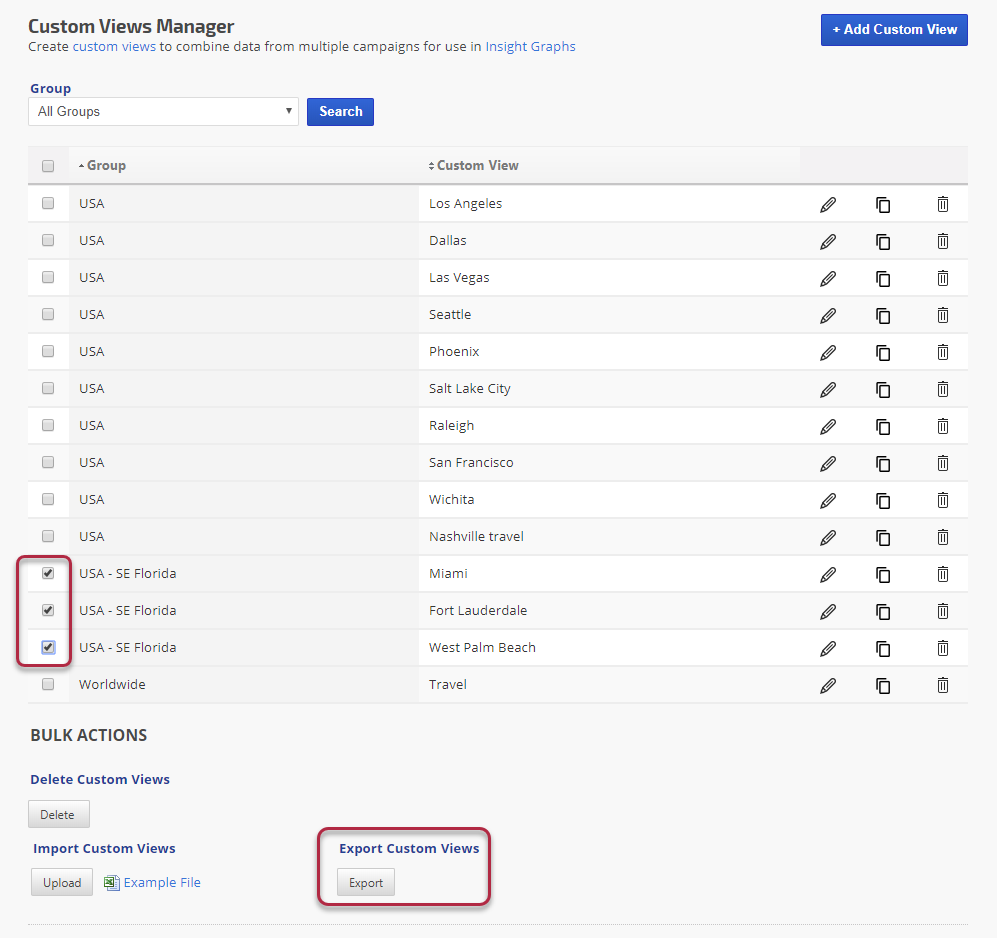
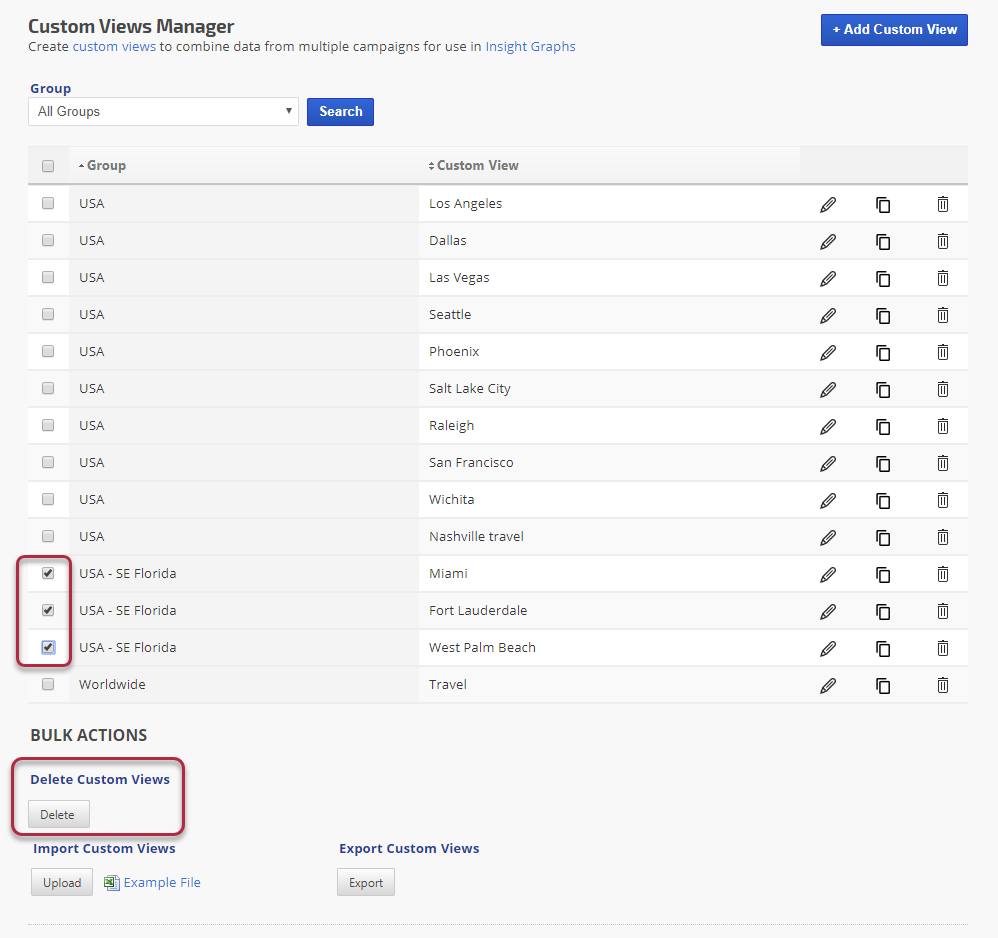
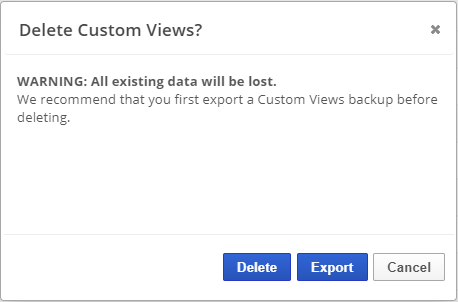
After creating custom views with data groups in Tools > Custom Views, you can click the Custom View button in the Insight Graph and select from the list of views that have been created in your account.
- Select a Custom View and click the Add button
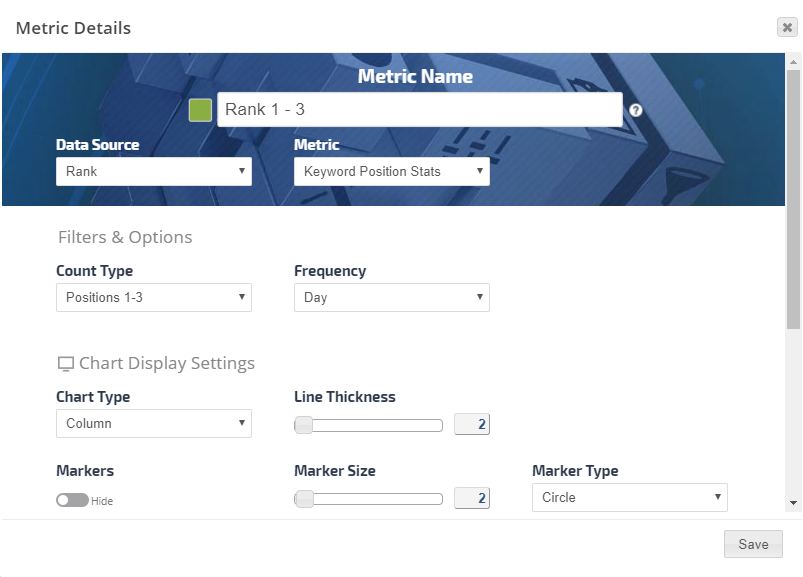
Add a Metric, you can choose from Rank:
- Keyword Position Stats
- Visibility Score
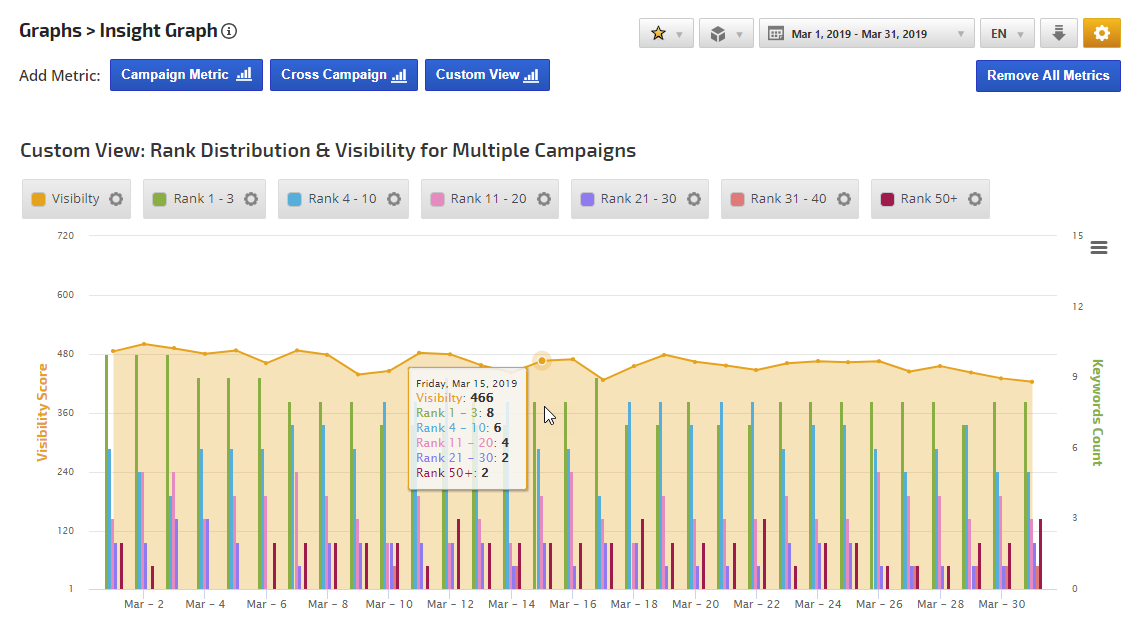
Insight Graph Example: Rank Distribution & Visibility for Multiple Campaigns
This graph was created by adding the following Custom View metrics:
- Visibility Score with Area chart type
- 6 Rank Position Stats metrics for different rank positions with Column chart type
Change to Stacked Columns View
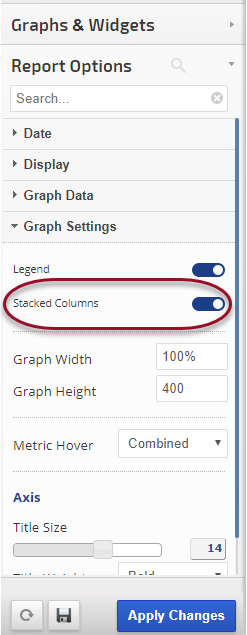
After adding all the metrics, if you've adding Column chart type you can change the Graph Settings to display as
Stacked Columns and click the
Apply Changes button.
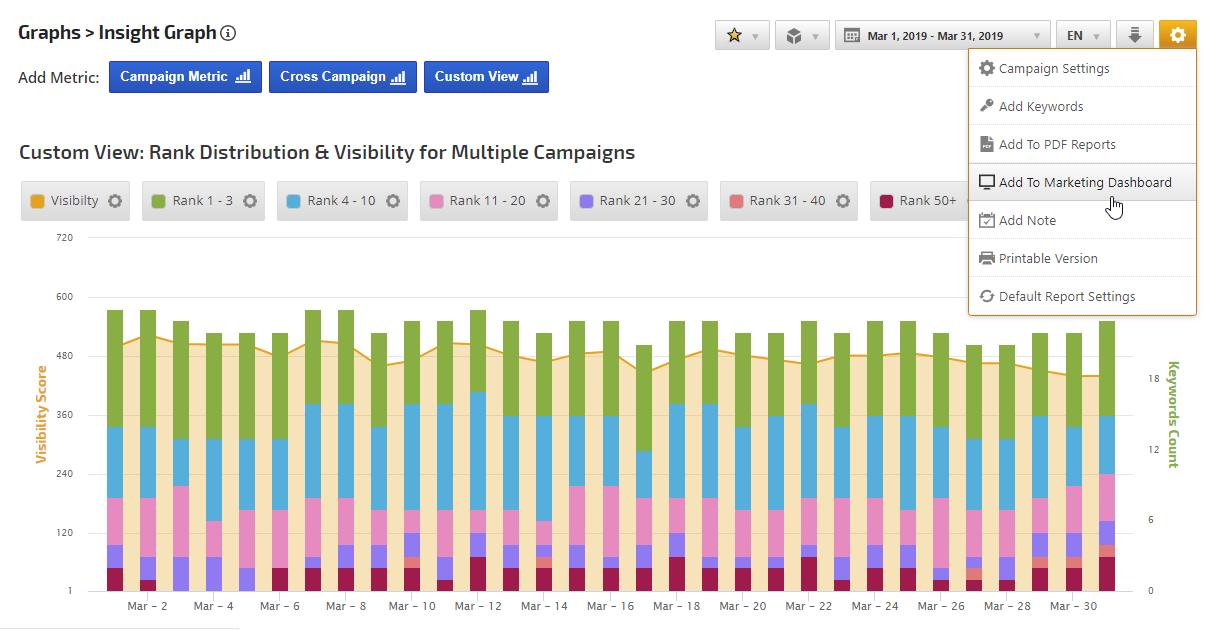
Insight Graph Example: Customs Views with Stacked Columns
Results after building a column graph and enabling Stacked Columns in Report Options > Graph Settings
To add this graph to a Marketing Dashboard or PDF Report, hover over the gear icon in the upper right and select the option and follow the on-screen instructions.
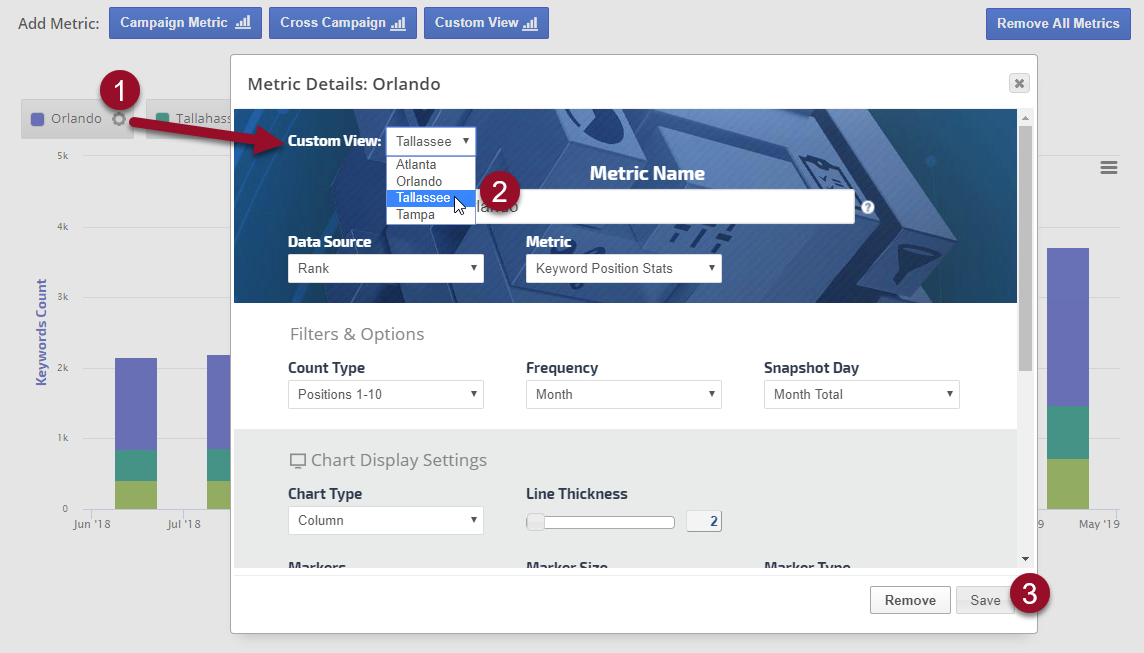
Edit Custom View
After saving a custom view metric, you can change the view:
1. Click the metric's gear / settings icon
2. Select a different Custom View
3. Click the Save button
